
Python · Full analysis · Review September 2026
Vitamin C and calories.
From question to evidence.
Which fruit has the most vitamin C? Raw acerola leads the fruit category in this dataset at 1,677.6 mg per 100 g. Explore the ranking, data preparation, water–energy relationship and reviewed calorie models, with Python code beside the results.
Jump to the vitamin C result and corrected code →
Open to everyone · No sign-in
One food per row. A common 100 g basis.
The DataCamp competition dataset was adapted from USDA FoodData Central. Its 12 columns contain a food identifier, description, category and nine nutrient or energy fields. The names below are preserved from the source.
| Food | Category | Energy (kcal) | Water (g) |
|---|---|---|---|
| Pillsbury Golden Layer Buttermilk Biscuits, Artificial Flavor, refrigerated dough | Baked Products | 307.0 | 35.5 |
| Pillsbury, Cinnamon Rolls with Icing, refrigerated dough | Baked Products | 330.0 | 27.9 |
| Kraft Foods, Shake N Bake Original Recipe, Coating for Pork, dry | Baked Products | 377.0 | 3.2 |
| George Weston Bakeries, Thomas English Muffins | Baked Products | 232.0 | 42.6 |
| Waffles, buttermilk, frozen, ready-to-heat | Baked Products | 273.0 | 40.3 |
View all 25 category counts
| Category | Foods |
|---|---|
| American Indian/Alaska Native Foods | 165 |
| Baby Foods | 345 |
| Baked Products | 517 |
| Beef Products | 954 |
| Beverages | 366 |
| Breakfast Cereals | 195 |
| Cereal Grains and Pasta | 181 |
| Dairy and Egg Products | 291 |
| Fast Foods | 312 |
| Fats and Oils | 216 |
| Finfish and Shellfish Products | 264 |
| Fruits and Fruit Juices | 355 |
| Lamb, Veal, and Game Products | 464 |
| Legumes and Legume Products | 290 |
| Meals, Entrees, and Side Dishes | 81 |
| Nut and Seed Products | 137 |
| Pork Products | 336 |
| Poultry Products | 383 |
| Restaurant Foods | 109 |
| Sausages and Luncheon Meats | 167 |
| Snacks | 176 |
| Soups, Sauces, and Gravies | 254 |
| Spices and Herbs | 63 |
| Sweets | 358 |
| Vegetables and Vegetable Products | 814 |
Convert the units. Preserve missingness.
Numeric values are extracted from strings such as 5.88 g and 307.0 kcal. Missing entries remain missing. Each calculation then selects the inputs it actually needs, instead of dropping every row with any missing field.
| Field | Missing rows | Share of all foods |
|---|---|---|
| Alcohol | 2,394 | 30.7% |
| Fiber | 562 | 7.2% |
| Vitamin C | 461 | 5.9% |
| Cholesterol | 399 | 5.1% |
Calories, protein, carbohydrate, fat and water have no missing values in this extract.
Open the actual cleaning code
names={'Calories':'calories','Protein':'protein','Carbohydrate':'carb','Total fat':'fat','Cholesterol':'cholesterol','Fiber':'fiber','Water':'water','Alcohol':'alcohol','Vitamin C':'vitamin_c'}
data=raw[['FDC_ID','Item','Category']].copy()
for src,dst in names.items():
    data[dst]=pd.to_numeric(raw[src].astype('string').str.extract(r'^\s*([-+]?\d+(?:\.\d+)?)',expand=False),errors='coerce')
# Missing values stay missing; no unverified assumption that missing means zero.
missing=data[list(names.values())].isna().sum().to_dict()What the food records show.
More water, lower energy density
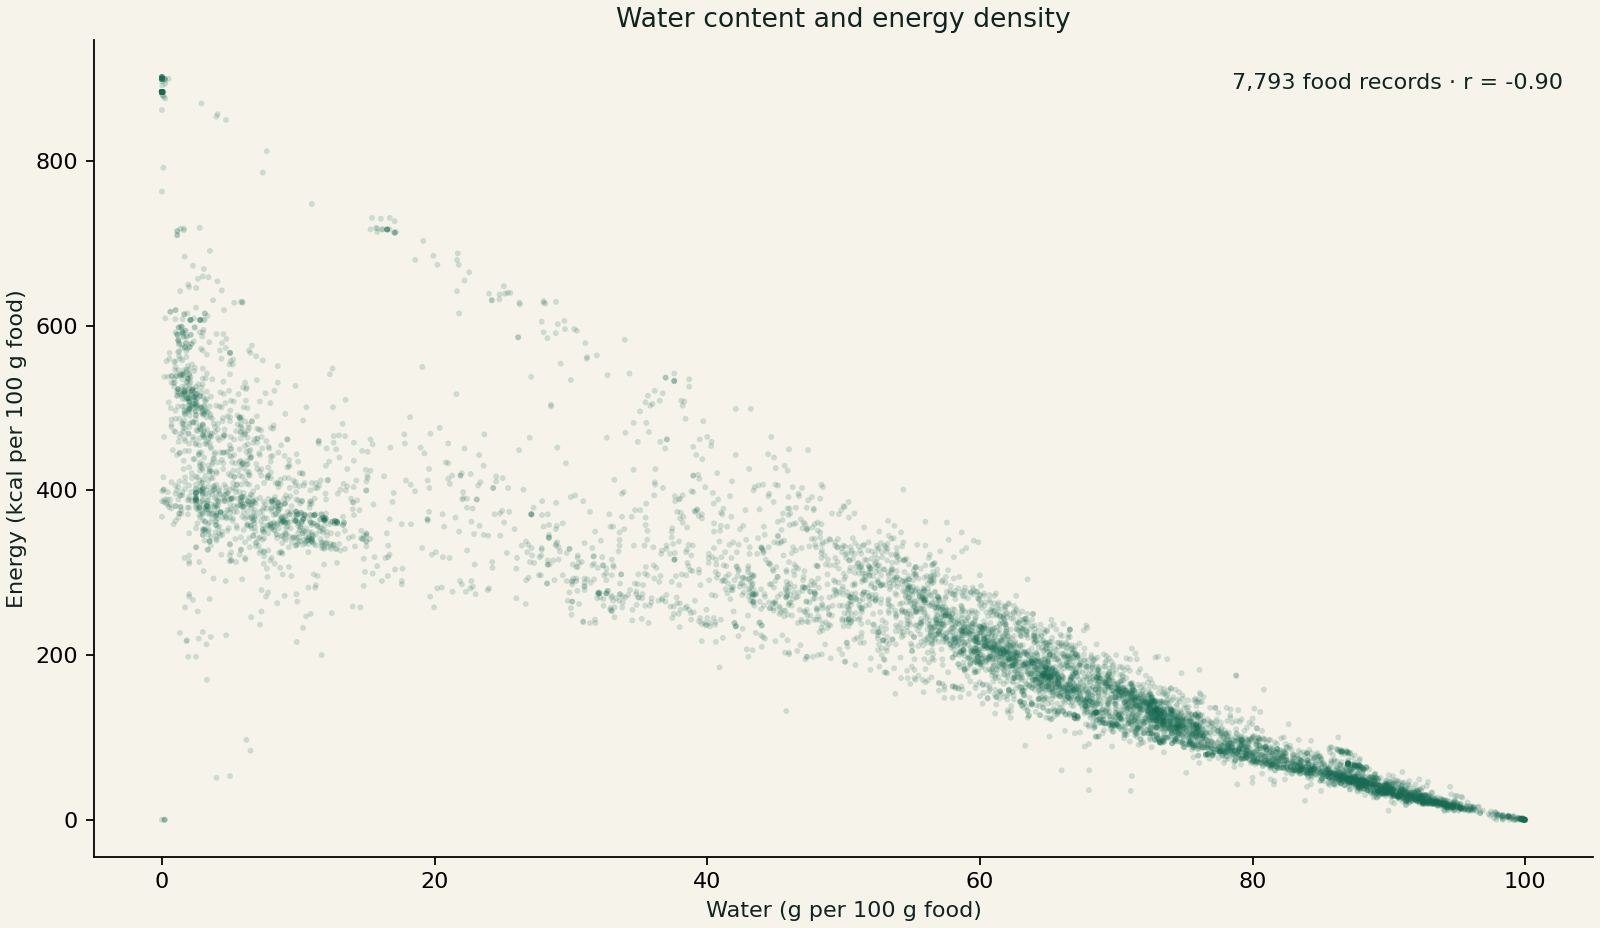
Across 7,793 foods, water and calories have Pearson r = −0.895. This describes a strong negative association within the dataset on a per-100-g basis.
Which fruits contain the most vitamin C in this dataset?
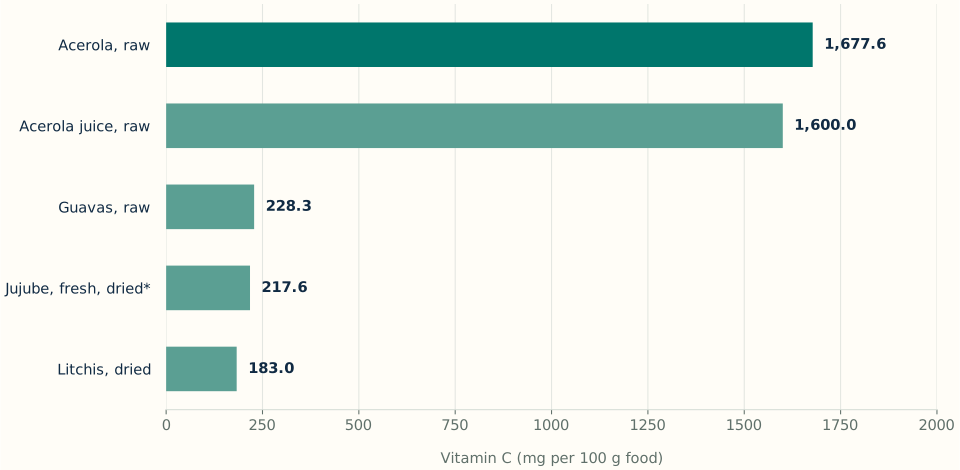
Raw acerola ranks highest among records in the Fruits and Fruit Juices category: 1,677.6 mg per 100 g. Fresh foods, juices and dried foods share the same mass basis but are different product forms.
| Source food name | Vitamin C (mg / 100 g) |
|---|---|
| Acerola, (west indian cherry), raw | 1,677.6 |
| Acerola juice, raw | 1,600.0 |
| Guavas, common, raw | 228.3 |
| Jujube, Chinese, fresh, dried | 217.6 |
| Litchis, dried | 183.0 |
The ranking includes 349 of 355 records in the fruit category; six with missing vitamin C are excluded only from this calculation. The original printed value used integer truncation (1,677). The corrected result preserves the source precision: 1,677.6 mg per 100 g.
This is a ranking within this dataset, not a claim about every fruit worldwide. Fresh, juiced and dried products differ; a common mass does not represent a common usual serving or a clinical recommendation.
Open the corrected vitamin C code
"""Reproduce the fruit vitamin C result. Run beside nutrition.csv."""
import pandas as pd

# Reload the source so earlier notebook zero-filling cannot affect this result.
vitamin_c_source = pd.read_csv("nutrition.csv")
vitamin_c_source["Vitamin C_mg"] = pd.to_numeric(
    vitamin_c_source["Vitamin C"].astype("string").str.extract(
        r"^\s*([-+]?\d+(?:\.\d+)?)", expand=False
    ), errors="coerce"
)

# Only missing vitamin C excludes a fruit from this ranking.
df_foodFruit = vitamin_c_source.loc[
    vitamin_c_source["Category"].eq("Fruits and Fruit Juices")
].copy()
fruit_missing = int(df_foodFruit["Vitamin C_mg"].isna().sum())
eligible_fruits = df_foodFruit.dropna(subset=["Vitamin C_mg"])
if eligible_fruits.empty:
    raise ValueError("No fruit records with a reported vitamin C value.")

# Keep every tied maximum and preserve the decimal precision.
ConcVitC = float(eligible_fruits["Vitamin C_mg"].max())
df_foodFruit_HvitC = eligible_fruits.loc[
    eligible_fruits["Vitamin C_mg"].eq(ConcVitC)
]
itemFruitHC = df_foodFruit_HvitC["Item"].tolist()
print(f"Ranked {len(eligible_fruits)} of {len(df_foodFruit)} fruit records; "
      f"excluded {fruit_missing} with missing vitamin C.")
for food_name in itemFruitHC:
    print(f"Highest recorded fruit vitamin C: {food_name} — "
          f"{ConcVitC:,.1f} mg per 100 g.")
print("Scope: Fruits and Fruit Juices in this dataset; product forms vary.")

Top10Fruit = eligible_fruits.nlargest(10, "Vitamin C_mg")
print(Top10Fruit[["Item", "Vitamin C_mg"]].to_string(index=False))
Explore the original food-group question
This revisits the original notebook’s food-group question. A food with zero recorded carbohydrate is not a complete diet. Means are unweighted across food records; missing cholesterol is excluded from its mean, with its denominator shown.
| Food group | Rows | Mean kcal | Mean fat (g) | Mean cholesterol (mg) | Cholesterol values |
|---|---|---|---|---|---|
| All foods | 7,793 | 220.2 | 10.7 | 45.0 | 7,394 |
| Zero-carbohydrate foods | 2,138 | 233.6 | 15.6 | 95.7 | 2,087 |
| 500 highest-protein foods | 500 | 242.7 | 9.7 | 99.6 | 493 |
All means use a 100 g basis. These groups overlap and are descriptive selections; they cannot establish dietary benefits, harms or disease risk.
Download comparison CSVEvaluate each model on the same foods.
The original macronutrient model, fitted without an intercept, gives 4.137 kcal/g for protein, 8.844 for fat and 3.854 for carbohydrate when recalculated on all positive-calorie rows. The review below uses a separate, common evaluation sample.
- 1. Same eligible rows
5,334 foods with positive calories and complete protein, fat, carbohydrate, alcohol and fiber inputs.
- 2. Fixed split
Seed 42; approximately 20% within each category for testing: 4,278 training and 1,056 test rows.
- 3. Compare held-out errors
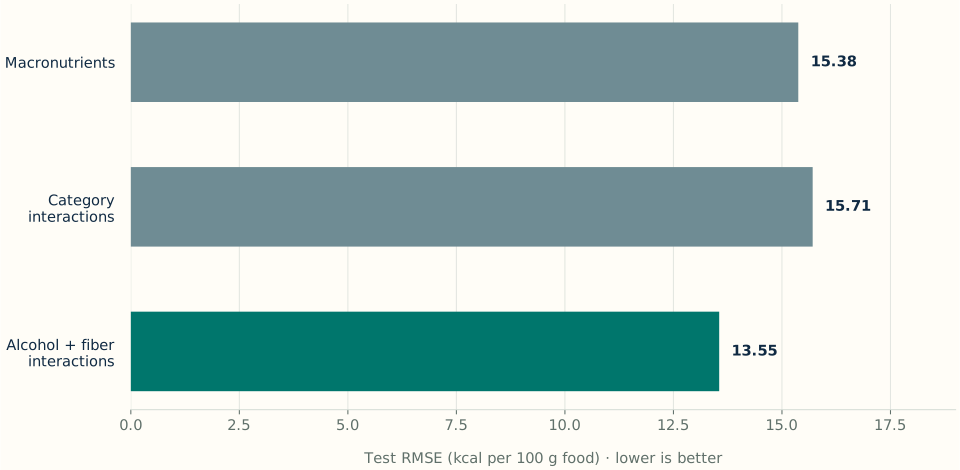
Fit on training rows only, then calculate MAE and RMSE on the same test rows for all three specifications.
| Specification | MAE (kcal) | RMSE (kcal) | Rank / columns |
|---|---|---|---|
| Macronutrients | 6.86 | 15.38 | 3 / 3 |
| Category interactions | 6.04 | 15.71 | 100 / 100 |
| Alcohol and fiber interactions | 4.70 | 13.55 | 126 / 150 |
MAE is mean absolute error; RMSE is root mean squared error. Both are in kcal per 100 g. Results come from the September 2026 review, not the original submission.
The final design matrix has rank 126 for 150 columns, so individual coefficients are not uniquely identifiable. Related foods may occur in both splits, and complete-case selection can introduce bias. This is an internal exploratory comparison, not validation on a new population or a clinical prediction tool.
Read the code behind the results.
The complete review script is available below. It uses pandas for preparation, NumPy least squares for the model specifications and Matplotlib for the scatter plot. Code stays in English in both editions.
Open the complete review script
"""Reproducible 2026 review of Shamseldeen's 2023 DataCamp nutrition study.

Run: python reviewed_analysis.py --data nutrition.csv --output results
The original study used statsmodels. This companion uses NumPy least squares
to make the specifications and common evaluation sample explicit.
"""
import argparse,json
from pathlib import Path
import numpy as np
import pandas as pd
import matplotlib
matplotlib.use('Agg')
import matplotlib.pyplot as plt

def main():
    parser=argparse.ArgumentParser()
    parser.add_argument('--data',default='nutrition.csv')
    parser.add_argument('--output',default='results')
    args=parser.parse_args()
    out=Path(args.output);out.mkdir(parents=True,exist_ok=True)
    raw=pd.read_csv(args.data)
    names={'Calories':'calories','Protein':'protein','Carbohydrate':'carb','Total fat':'fat','Cholesterol':'cholesterol','Fiber':'fiber','Water':'water','Alcohol':'alcohol','Vitamin C':'vitamin_c'}
    data=raw[['FDC_ID','Item','Category']].copy()
    for src,dst in names.items():
        data[dst]=pd.to_numeric(raw[src].astype('string').str.extract(r'^\s*([-+]?\d+(?:\.\d+)?)',expand=False),errors='coerce')
    # Missing values stay missing; no unverified assumption that missing means zero.
    missing=data[list(names.values())].isna().sum().to_dict()
    sample=data.dropna(subset=['calories','protein','fat','carb','alcohol','fiber']).copy()
    sample=sample.loc[sample.calories>0].reset_index(drop=True)
    # Same rows and deterministic split across all models, stratified by food category.
    rng=np.random.default_rng(42);test_idx=[]
    for _,group in sample.groupby('Category',sort=True):
        ids=group.index.to_numpy();rng.shuffle(ids)
        if len(ids)>=5:test_idx.extend(ids[:max(1,int(len(ids)*.2))])
    test=np.zeros(len(sample),dtype=bool);test[test_idx]=True;train=~test
    categories=pd.get_dummies(sample.Category,dtype=float).to_numpy()
    def matrix(cols,interactions):
        x=sample[cols].to_numpy(dtype=float)
        return np.column_stack([categories]+[categories*x[:,j,None] for j in range(x.shape[1])]) if interactions else x
    specs=[('Macronutrients',['protein','fat','carb'],False),('Category interactions',['protein','fat','carb'],True),('Alcohol and fiber interactions',['protein','fat','carb','alcohol','fiber'],True)]
    metrics=[];y=sample.calories.to_numpy(dtype=float)
    for label,cols,interactions in specs:
        x=matrix(cols,interactions);beta,_,rank,_=np.linalg.lstsq(x[train],y[train],rcond=None)
        pred=x@beta
        err=pred[test]-y[test]
        metrics.append({'model':label,'train_rows':int(train.sum()),'test_rows':int(test.sum()),'parameters':x.shape[1],'rank':int(rank),'test_mae_kcal':float(np.abs(err).mean()),'test_rmse_kcal':float(np.sqrt(np.mean(err**2))),'test_r2':float(1-np.sum(err**2)/np.sum((y[test]-y[test].mean())**2))})
    # Reproduce the saved original baseline using all positive-calorie records.
    baseline=data.loc[data.calories>0].dropna(subset=['protein','fat','carb'])
    coeff=np.linalg.lstsq(baseline[['protein','fat','carb']].to_numpy(dtype=float),baseline.calories.to_numpy(dtype=float),rcond=None)[0]
    correlation=float(data[['water','calories']].corr().iloc[0,1])
    fruits=data[data.Category=='Fruits and Fruit Juices'].dropna(subset=['vitamin_c']).nlargest(5,'vitamin_c')
    result={'reviewDate':'2026-09-23','originalPublicationDate':'2023-12-11','rows':len(raw),'categories':int(raw.Category.nunique()),'completeAllOriginalColumns':int(raw.dropna().shape[0]),'missing':{k:int(v) for k,v in missing.items()},'modelSampleRows':len(sample),'waterCaloriesPearsonR':correlation,'baselineCoefficients':dict(zip(['protein','fat','carb'],map(float,coeff))),'topFruitVitaminC':fruits[['Item','vitamin_c']].to_dict('records'),'models':metrics,'limitations':['A random row split is an internal check, not validation on a new population. Similar products can occur across the split.','Complete-case sampling can be biased; missing alcohol values are common.','Category-interaction models can be rank deficient; least squares provides one minimum-norm solution.','Energy is closely related to nutrient quantities by construction. High R-squared is not clinical evidence.','This descriptive food-composition study cannot infer health outcomes or recommend diets.']}
    (out/'metrics.json').write_text(json.dumps(result,indent=2))
    pd.DataFrame(metrics).to_csv(out/'model_comparison.csv',index=False)
    plt.rcParams.update({'font.family':'DejaVu Sans','axes.spines.top':False,'axes.spines.right':False,'axes.labelcolor':'#10231e','text.color':'#10231e'})
    fig,ax=plt.subplots(figsize=(10,5.8),layout='constrained');fig.patch.set_facecolor('#f6f3eb');ax.set_facecolor('#f6f3eb')
    ax.scatter(data.water,data.calories,s=7,alpha=.18,color='#176b52',edgecolors='none',rasterized=True)
    ax.set(xlabel='Water (g per 100 g food)',ylabel='Energy (kcal per 100 g food)',title='Water content and energy density')
    ax.text(.98,.96,f'7,793 food records · r = {correlation:.2f}',ha='right',va='top',transform=ax.transAxes)
    fig.savefig(out/'water-calories.png',dpi=160);plt.close(fig)
    print(json.dumps(result,indent=2))

if __name__=='__main__':main()
Run the analysis locally
Clone the repository and run these commands from learning/nutrition. The last command rebuilds the web tables, additional charts and both full-analysis pages.
python -m pip install -r requirements.txt
python reviewed_analysis.py --data nutrition.csv --output results
python build_web_analysis.pyRead the archived 2023 notebook.
All 99 cells in the public archive are preserved below, in their original English. This archive retains the historical code, removes stored outputs and revises one unsupported health-outcome statement. It has not been rerun; the results above belong to the separate 2026 review.
The original zero-filling, in-sample comparisons and hypothetical prediction grids are historical learning steps. The reviewed approach and its limits are explained above.
Read all 99 archived cells · English
Archived 2023 nutrition analysis
Author: Shamseldeen Ismaiil. Original publication: 11 December 2023. Portfolio archive prepared 23 September 2026. Original code is preserved; stored outputs are removed for portability and one unsupported health-outcome statement is replaced by a descriptive limitation. This historical notebook has not been rerun. Known issues include missing-value zero imputation, a mismatch between the described and actual final modeling frame, in-sample model comparison, and extrapolation to impossible nutrient combinations. Read README.md and use reviewed_analysis.py for the reproducible 2026 review.What is good food?
📖 Background
You and your friend have gotten into a debate about nutrition. Your friend follows a high-protein diet and does not eat any carbohydrates (no grains, no fruits). You claim that a balanced diet should contain all nutrients but should be low in calories. Both of you quickly realize that most of what you know about nutrition comes from mainstream and social media. Being the data scientist that you are, you offer to look at the data yourself to answer a few key questions.💾 The data
You source nutrition data from USDA's FoodData Central website. This data contains the calorie content of 7,793 common foods, as well as their nutritional composition. Each row represents one food item, and nutritional values are based on a 100g serving. Here is a description of the columns: - FDC_ID: A unique identifier for each food item in the database. - Item: The name or description of the food product. - Category: The category or classification of the food item, such as "Baked Products" or "Vegetables and Vegetable Products". - Calories: The energy content of the food, presented in kilocalories (kcal). - Protein: The protein content of the food, measured in grams. - Carbohydrate: The carbohydrate content of the food, measured in grams. - Total fat: The total fat content of the food, measured in grams. - Cholesterol: The cholesterol content of the food, measured in milligrams. - Fiber: The dietary fiber content of the food, measured in grams. - Water: The water content of the food, measured in grams. - Alcohol: The alcohol content of the food (if any), measured in grams. - Vitamin C: The Vitamin C content of the food, measured in milligrams.Cell 04 / 99 · code
import pandas as pd
df_food = pd.read_csv('nutrition.csv')
summary:
Create a report that covers the following: 1. fruit has the highest vitamin C and some other sources of vitamin C. 2. the relationship between the calories and water content 3. possible drawbacks of a zero-carb diet drawbacks of a very high-protein diet. 4. fit a linear model to find that kcal in protein, carbohydrates and fat. 5. Alcohol as a source of calories.Cell 07 / 99 · code
df_food.info()Cell 09 / 99 · code
df_food_Nna = df_food.dropna()
df_food_Nna.info()
Cell 11 / 99 · code
import numpy as np
df_food[['Vitamin C','Cholesterol']] = df_food[['Vitamin C','Cholesterol']].fillna('0.0 mg')
df_food[['Fiber','Alcohol']]= df_food[['Fiber','Alcohol']].fillna('0.0 g')
Cell 13 / 99 · code
def DataframeAddCol(df, dic):
    """
    Function to convert string columns with 'mg, g, kca, ...' to float and add new columns to the dataframe.
    df: DataFrame, dic: dictionary of column names and measurements like mg, g, ...
    """
    for i, x in dic.items():
        new_col_name = i + "_" + x
        df[new_col_name] = pd.to_numeric(df[i].str.split(x).str[0], errors='coerce')
    return df
Cell 15 / 99 · code
dictcol = {"Calories":"kcal",
          "Protein":"g",
          "Carbohydrate":"g",
          "Total fat":"g",
          "Cholesterol":"mg",
          "Fiber":"g",
          "Water":"g",
          "Alcohol":"g",
          "Vitamin C":"mg"}
DataframeAddCol(df_food,dictcol)
Cell 17 / 99 · code
print(df_food.info())Cell 19 / 99 · code
df_food_No = df_food[['FDC_ID','Item','Category','Calories_kcal',
              'Protein_g',
              'Carbohydrate_g',
              'Total fat_g',
              'Cholesterol_mg',
              'Fiber_g',
              'Water_g',
              'Alcohol_g',
              'Vitamin C_mg']]


df_food_No.info()
Cell 21 / 99 · code
highCfood = df_food_No[df_food['Vitamin C_mg'] == df_food['Vitamin C_mg'].max()]
Cell 22 / 99 · code
highCfoodCell 24 / 99 · code
df_foodFruit = df_food[df_food['Category'].isin(['Fruits and Fruit Juices'])]
df_foodFruit_HvitC = df_foodFruit[df_foodFruit['Vitamin C_mg'] == df_foodFruit['Vitamin C_mg'].max()]
itemFruitHC = list(df_foodFruit_HvitC['Item'])
ConcVitC = df_foodFruit_HvitC['Vitamin C_mg']

print(f"Now,the fruit has the heighest vitamin C content,This fruit is named '{itemFruitHC[0].split(',')[0]}' and it has a concentration of vitamin C equal {int(ConcVitC)} mg.")
Cell 25 / 99 · code
import seaborn as sns
import matplotlib.pyplot as plt
df_food_No['Vitamin_C_mg'] = df_food_No['Vitamin C_mg']
ConcVitC = float(ConcVitC)

df_food_No['point_type'] = ['Highest vitC Fruit "Acerola"' if VitC == ConcVitC else 'Others' for VitC in df_food_No.Vitamin_C_mg]
sns.scatterplot(x = 'Vitamin_C_mg',
                y = 'Water_g',
                hue = 'point_type',
                data = df_food_No)
plt.show()
Cell 27 / 99 · code
def highconc(column1,colNam='Vitamin C_mg',df0=df_food):
    """
    column1 is category of item
    column2 is numeric to take max
    take the max vitamin c in each item in column
    return all dataframe columns
    but only unique item of selected column
    """
    listcolumn1 = list(column1.unique())
    df = pd.DataFrame()
    for i in listcolumn1:
        df1 = df0[column1.isin([i])]

        df2 = df1[df1[colNam] == df1[colNam].max()]
        df = pd.concat([df2, df], ignore_index=True)

    return df
Cell 28 / 99 · code
dfhighC = highconc(df_food_No['Category'],df0=df_food_No)
Cell 29 / 99 · code
dfhighC.drop(index=18,axis=0,inplace=True)
Cell 31 / 99 · code
dfhighC[['Item','Category','Vitamin_C_mg']].sort_values('Vitamin_C_mg', ascending=False)
Cell 32 / 99 · code
df_foodVeg = df_food[df_food['Category'].isin(['Vegetables and Vegetable Products'])]Cell 33 / 99 · code
Top10Fruit = df_foodFruit.sort_values('Vitamin C_mg', ascending= False).head(10)
Top10Veg = df_foodVeg.sort_values('Vitamin C_mg', ascending= False).head(10)
Top10dfFood = df_food.sort_values('Vitamin C_mg', ascending=False).head(10)

Alternative10 = dfhighC.sort_values('Vitamin C_mg',ascending=False).head(10)
Cell 35 / 99 · code
Alternative10[['Item','Category','Vitamin C_mg']].reset_index(drop=True)Cell 37 / 99 · code
Top10dfFood[['Item','Vitamin C_mg']].reset_index(drop=True)Cell 39 / 99 · code
Top10Veg[['Item','Vitamin C_mg']].reset_index(drop=True)Cell 41 / 99 · code
Top10Fruit[['Item','Vitamin C_mg']].reset_index(drop=True)Cell 43 / 99 · code
sns.regplot(y='Calories_kcal',
            x='Water_g',
            data=df_food,
            ci=None)

plt.show()What are the possible drawbacks of a zero-carb diet?
Cell 45 / 99 · code
ZeroCarb = df_food_No[df_food_No['Carbohydrate_g' ]== 0.0]
ZeroCarb.info()
Cell 46 / 99 · code
ZeroCarb[['Calories_kcal','Total fat_g', 'Cholesterol_mg']].mean()Cell 47 / 99 · code
df_food_No[['Calories_kcal','Total fat_g', 'Cholesterol_mg']].mean()What could be the drawbacks of a very high-protein diet?
Cell 49 / 99 · code
Top_500_high_protein = df_food_No.sort_values('Protein_g',ascending=False).head(500)
Top_500_high_protein.sort_values('Cholesterol_mg',ascending=False)
Cell 50 / 99 · code
Top_500_high_protein[['Calories_kcal','Total fat_g', 'Cholesterol_mg']].mean()Descriptive cholesterol comparison
These selected food groups have different cholesterol levels in this dataset. This comparison cannot establish disease risk or clinical diet effects.According to the Cleveland Clinic website, a gram of fat has around 9 kilocalories, and a gram of protein and a gram of carbohydrate contain 4 kilocalories each. Fit a linear model to test whether these estimates agree with the data.
Cell 53 / 99 · code
NoZeroCal = df_food_No[df_food_No['Calories_kcal'] != 0.0]
NoZeroCal['Fat_g'] = NoZeroCal['Total fat_g']
Cell 54 / 99 · code
NoZeroCal.info()Cell 56 / 99 · code
from statsmodels.formula.api import ols
# Fit the model
mdl_calories_vs_P_F_C = ols('Calories_kcal ~ Protein_g + Fat_g + Carbohydrate_g + 0', data=NoZeroCal).fit()

# Create the explanatory data
explanatory_dataPFC = pd.DataFrame({'Protein_g': [1, 0, 0,0,10,5.88,200],
                                   'Fat_g': [0, 1, 0,0,20,13.24,100],
                                   'Carbohydrate_g': [0, 0, 1,0,15,41.18,100]})
# Predict 'Calories_kcal'
prediction_data = explanatory_dataPFC.assign(Calories_kcal=mdl_calories_vs_P_F_C.predict(explanatory_dataPFC))

# Calculate MSE and RSE
mse = mdl_calories_vs_P_F_C.mse_resid
rse = np.sqrt(mse)
Cell 57 / 99 · code
df_food_No.iloc[0][3:7]Cell 58 / 99 · code
print(mdl_calories_vs_P_F_C.params)Cell 59 / 99 · code
explanatory_dataPFCCell 60 / 99 · code
print(mdl_calories_vs_P_F_C.rsquared)
print(mdl_calories_vs_P_F_C.rsquared_adj)Analyze the errors of your linear model to see what could be the hidden sources of calories in food.
Cell 62 / 99 · code
print('MSE :', mse)
print('RSE :', rse)
Cell 63 / 99 · code
prediction_dataCell 64 / 99 · code
plt.figure()
sns.regplot(y='Calories_kcal',
            x='Protein_g',
            data=NoZeroCal,
            ci=None,
            scatter_kws={'alpha': 0.5},
            color=sns.color_palette("deep")[0],
            label='Protein')
sns.regplot(y='Calories_kcal',
            x='Fat_g',
            data=NoZeroCal,
            ci=None,
            scatter_kws={'alpha': 0.5},
            color=sns.color_palette("deep")[1],
            label='Fat')
sns.regplot(y='Calories_kcal',
            x='Carbohydrate_g',
            data=NoZeroCal,
            ci=None,
            scatter_kws={'alpha': 0.5},
            color=sns.color_palette("deep")[2],
            label='Carbohydrate')

plt.xlabel('Grams')
plt.ylabel('Calories (kcal)')
plt.legend()
plt.show()
Cell 65 / 99 · code
NoZeroCalCell 66 / 99 · code
from statsmodels.formula.api import ols
# Fit the model
mdl_calories_vs_P_F_C_cat = ols('Calories_kcal ~ Protein_g + Fat_g + Carbohydrate_g + Category + Category : Protein_g + Category:Fat_g + Category : Carbohydrate_g + 0', data=NoZeroCal).fit()
Cell 67 / 99 · code
from itertools import product Cell 68 / 99 · code
catList = list(NoZeroCal['Category'].unique())
proteinList = np.arange(0,50,10)
fatList = np.arange(0,50,10)
carbohydrateList = np.arange(0,50,10)
Cell 69 / 99 · code
p = product(catList, proteinList, fatList, carbohydrateList)Cell 70 / 99 · code
explanatoryDataPFCcat = pd.DataFrame(p,
    columns=["Category",
"Protein_g",
"Fat_g",
"Carbohydrate_g"])
Cell 71 / 99 · code
explanatoryDataPFCcatCell 72 / 99 · code
mse1 = mdl_calories_vs_P_F_C_cat.mse_resid
rse1 = np.sqrt(mse1)
print(mdl_calories_vs_P_F_C_cat.rsquared_adj)
print(mdl_calories_vs_P_F_C_cat.rsquared)
print("MSE:",mse1)
print("RSE:",rse1)
Cell 73 / 99 · code
predictionData = explanatoryDataPFCcat.assign(
    Calories_kcal = mdl_calories_vs_P_F_C_cat.predict(explanatoryDataPFCcat)
)
Cell 74 / 99 · code
predictionDataCell 75 / 99 · code
predp = predictionData[predictionData['Protein_g'] == 10]
predf = predictionData[predictionData['Fat_g'] == 10]
predcarb = predictionData[predictionData['Carbohydrate_g'] == 10]
Cell 76 / 99 · code
predpZeroF = predp[predp['Fat_g'] == 0]
predfZeroP = predf[predf['Protein_g'] == 0]
predcarbZeroP = predcarb[predcarb['Protein_g'] == 0]
Cell 77 / 99 · code
predpZeroFZeroCarb = predpZeroF[predpZeroF['Carbohydrate_g'] == 0]
predfZeroPZeroCarb = predfZeroP[predfZeroP['Carbohydrate_g'] == 0]
predcarbZeroPZeroF = predcarbZeroP[predcarbZeroP['Fat_g'] == 0]
Cell 78 / 99 · code
print("Calories mean in 10 gm protein:",predpZeroFZeroCarb["Calories_kcal"].mean())
print("Calories mean in 10 gm Fat:",predfZeroPZeroCarb["Calories_kcal"].mean())
print("Calories mean in 10 gm carbohydrates :",predcarbZeroPZeroF["Calories_kcal"].mean())the last model is better that the first and it doesn't work with very small amount of fat , carbohydrates and proteins. we find that 1gm of fat equal 9 kcal and 1 gm of protein and carbohydrate equal 4 kcal.
for example as first row of dataframe NoZeroCal we predict the calories of first row as 300
we find around 7 calories as a difference
to see what could be the hidden sources of calories in food
fit model to discover the hidden sources of calories
may be from fiber or alcohol. so we use df_food_Nna to drop any missing data. So we fit another model to predict if alcohol and fiber produce calories.
Cell 84 / 99 · code
df_food_Nna_no = DataframeAddCol(df_food_Nna,dictcol)Cell 85 / 99 · code
NoZeroCalNna = df_food_Nna_no[df_food_Nna_no['Calories_kcal'] != 0.0]Cell 86 / 99 · code
NoZeroCalNna.info()Cell 87 / 99 · code
mdl_calories_vs_All = ols('Calories_kcal ~ Protein_g + Fat_g + Carbohydrate_g + Alcohol_g + Fiber_g + Category + Category : Protein_g + Category:Fat_g + Category : Carbohydrate_g + Category : Alcohol_g + Category : Fiber_g + 0', data=NoZeroCal).fit()Cell 88 / 99 · code
CatList = list(NoZeroCalNna['Category'].unique())
AlcList = np.arange(0,50,10)
FibList = np.arange(0,50,10)
proteinList = np.arange(0,50,10)
fatList = np.arange(0,50,10)
carbohydrateList = np.arange(0,50,10)
Cell 89 / 99 · code
p1 = product(CatList, AlcList, FibList, proteinList, fatList, carbohydrateList )Cell 90 / 99 · code
explanatoryDataAll = pd.DataFrame(p1,
    columns=["Category",
"Alcohol_g",
"Fiber_g",
            "Protein_g",
            "Fat_g",
            "Carbohydrate_g"])
Cell 91 / 99 · code
mse2 = mdl_calories_vs_All.mse_resid
rse2 = np.sqrt(mse2)
print(mdl_calories_vs_All.rsquared_adj)
print(mdl_calories_vs_All.rsquared)
print("MSE:",mse2)
print("RSE:",rse2)
Cell 92 / 99 · code
predictionDataAll = explanatoryDataAll.assign(
    Calories_kcal = mdl_calories_vs_All.predict(explanatoryDataAll)
)
Cell 93 / 99 · code
predictionDataAllCell 94 / 99 · code
def dfonecolvalue(df, col1, val1, val2,li):
    """
    make one column with val1 and selected column of df in li list set their values to val2.
    df: dataframe of choice.
    col1: column that you want to set to the selected value.
    val1: value you want to select from col1.
    val2: value you want to select from all columns of the dataframe.
    li list of columns that set values to val2


    Returns a new dataframe named as df + col1 + val1.
    """
    new_df = df.copy()  # Create a copy of the original dataframe
    new_df = new_df[new_df[col1]==val1]
    for i in li:
        new_df = new_df[new_df[i]==val2]

    return new_df
Cell 95 / 99 · code
listAlc = ["Fiber_g","Protein_g","Fat_g","Carbohydrate_g"]
listFiber = ["Alcohol_g","Protein_g","Fat_g","Carbohydrate_g"]


df_10_Alc_predict = dfonecolvalue(predictionDataAll,"Alcohol_g",10,0,listAlc)
df_10_Fib_predict = dfonecolvalue(predictionDataAll,"Fiber_g",10,0,listFiber)
Cell 96 / 99 · code
df_10_Alc_predict["Calories_kcal"].mean()Cell 97 / 99 · code
df_10_Fib_predict["Calories_kcal"].mean()last we see that alcohol can give us around 7 kcal, this is hidden source of calories.
please, leave comment to help me to improve my skills
thanks 🙏 🌹❤️
Original publication: 11 December 2023. Data: DataCamp’s “What Foods Are the Most Nutritious?”, adapted from USDA FoodData Central. This was an unjudged learning competition. USDA FoodData Central ↗