
SQL & Data Warehousing
T-SQL, joins, CTEs, window functions, stored procedures, ETL, Medallion Architecture and dimensional modeling.
Open to Data Analyst & BI opportunities
I combine 10+ years of retail pharmacy experience with SQL, Python, Power BI and Tableau to turn complex operational data into clear business decisions.
I have worked at Aldawaa Pharmacies since 2015 across customer service, sales, insurance workflows and branch operations. That experience gives me practical context for the numbers behind retail and healthcare decisions.
My portfolio applies that context to practical analytics work. The flagship Power BI project connects sales, margin, customer behavior, targets and inventory risk. Alongside it, I am developing SQL and Python data warehouse projects with transparent progress. These are independent learning projects using synthetic or public datasets.
T-SQL, joins, CTEs, window functions, stored procedures, ETL, Medallion Architecture and dimensional modeling.
Power BI, DAX measures and filter context, Power Query, KPI definitions, interactive reporting, Tableau and business storytelling.
Pandas, NumPy, data cleaning, exploratory analysis, visualization and analytical automation.
Retail analytics, pharmacy operations, insurance workflows, sales, customer service and inventory KPIs.
Explore a working dashboard, read the business logic, and see what each project can—and cannot—tell you.
A six-page commercial reporting project for a fictional Saudi pharmaceutical distributor. Built to connect sales and margin with customers, sales-agent targets and inventory decisions.
Independent portfolio project · Synthetic training data · No employer or patient data
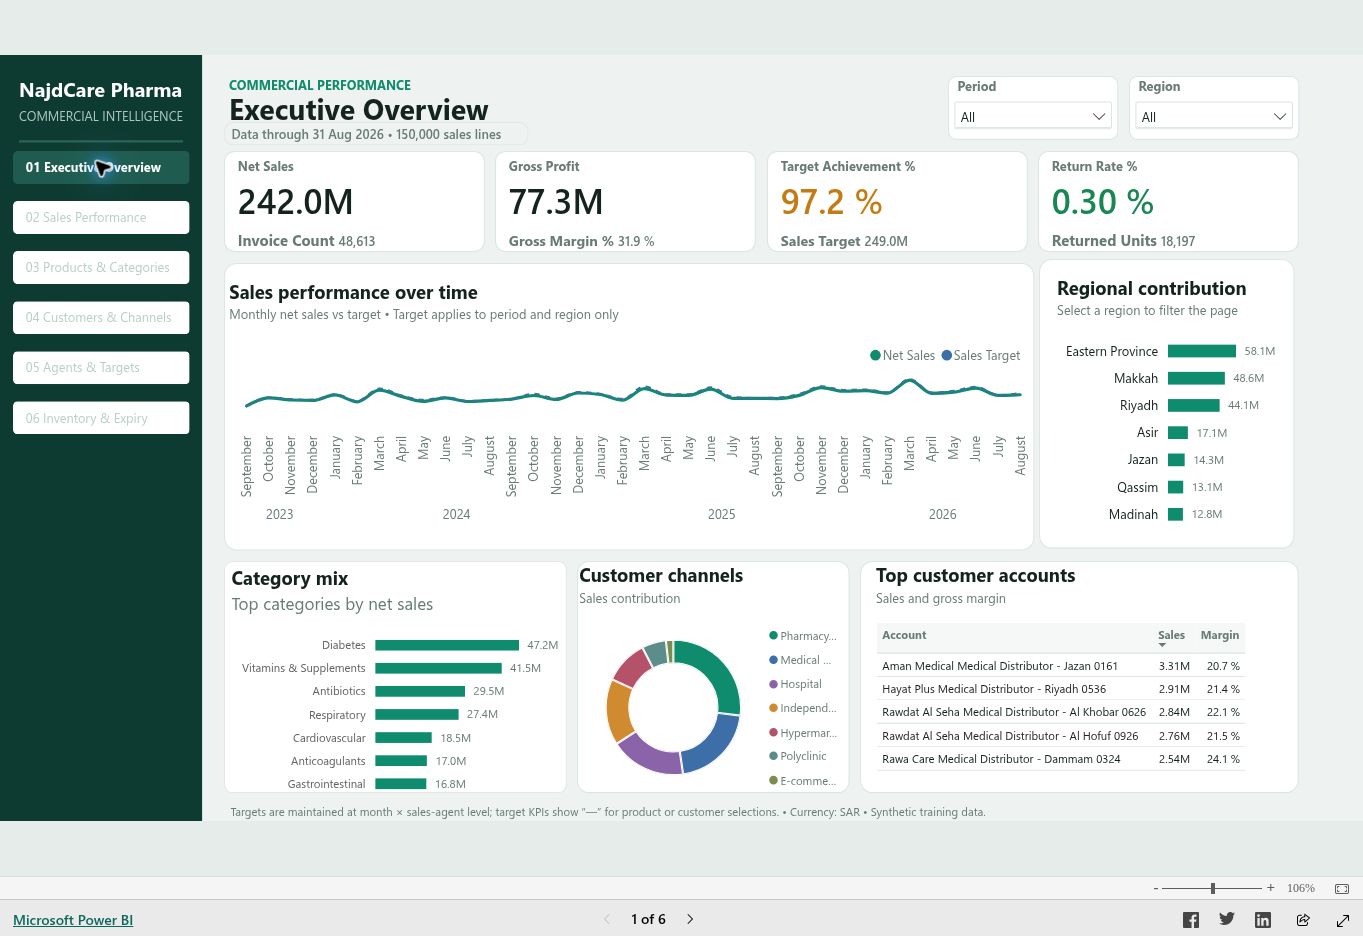 Explore the interactive report →

Which fruit has the most vitamin C? Explore 7,793 foods across 25 categories through data cleaning, nutrient comparisons, visualization and calorie modeling.
Original DataCamp publication: December 2023. Includes a reproducible review with model assumptions and evaluation limits.
Read the full analysis and code →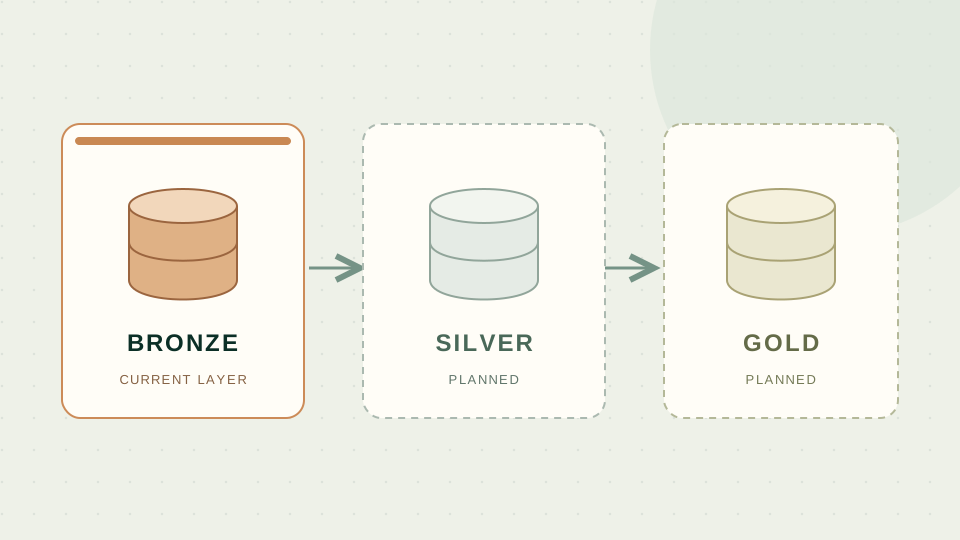
An enterprise analytics foundation integrating simulated pharmacy source systems through Bronze, Silver and Gold layers.
Current checkpoint: 72 Bronze tables and 60.2 million rows loaded. Validation and reconciliation precede the Silver / Gold and BI phases.
Explore the development repository ↗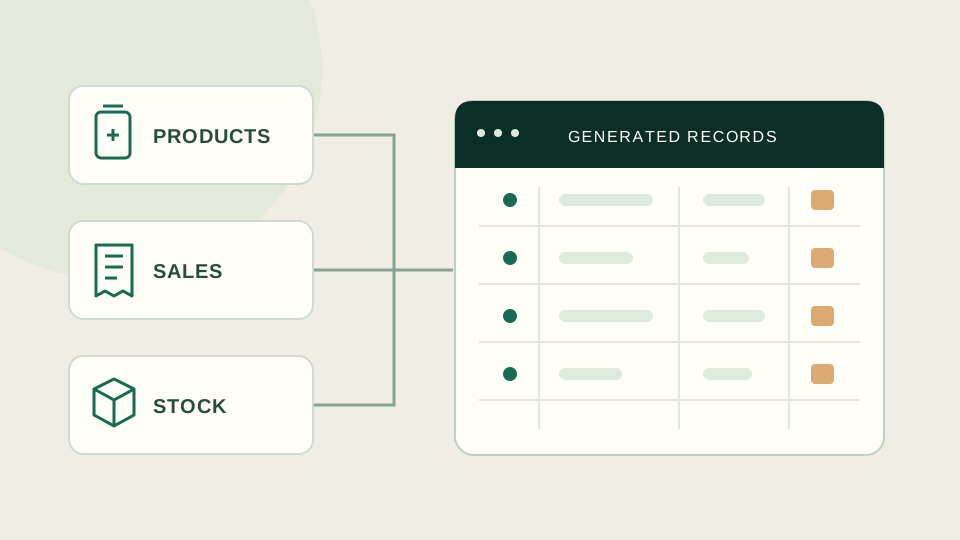
Building realistic source data for a large pharmacy chain to feed and test the enterprise data warehouse across operational domains.
View development work ↗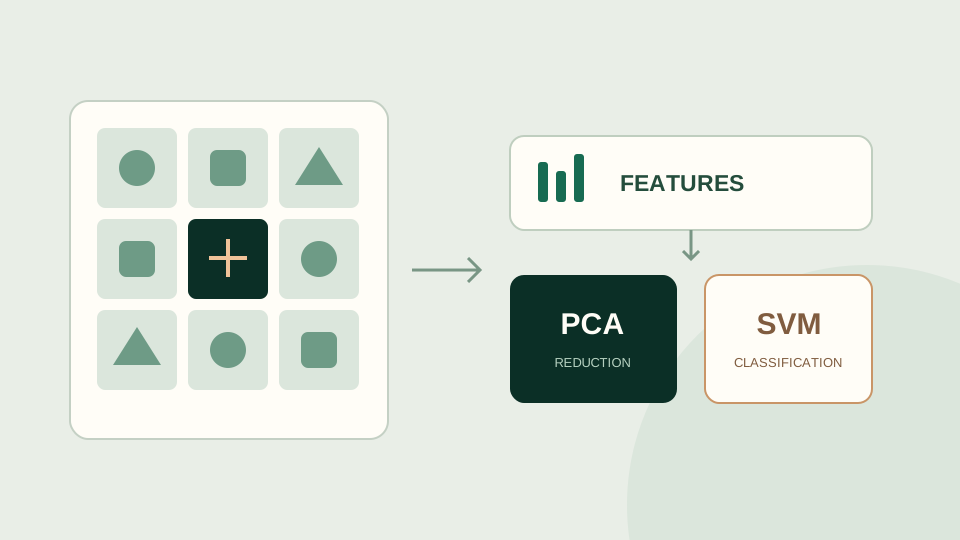
An early machine-learning notebook exploring image features, PCA and SVM classification using the UBC Ovarian Cancer dataset.
My DataCamp record brings together Python, SQL, statistics and machine learning, with direct accomplishment links and an applied nutrition analysis.

Activity verified September 2026. Training completion records include some historical project versions.
Explore learning, projects and credentials ↗Pharmacist · Retail Pharmacy Operations
Bachelor of Pharmaceutical Sciences · 2013
Available for the next challenge
Open to Data Analyst, BI Analyst, Reporting Analyst, Retail Analytics and Healthcare Analytics opportunities.