
Commercial performance
Are sales keeping pace with targets? Which products, customers and channels contribute to revenue and margin?
Flagship · Power BI · Live report
A connected view of sales, profitability, customers, targets and stock risk for a fictional pharmaceutical distributor in Saudi Arabia.
A reporting project designed around the questions a commercial manager, sales leader or inventory analyst needs to investigate.
Are sales keeping pace with targets? Which products, customers and channels contribute to revenue and margin?
Which agents and territories need attention? How do discounts, returns and customer mix change the interpretation of sales?
Where are stockouts, replenishment gaps and near-expiry positions concentrated? What should be reviewed first?
I brought pharmacy operations context into the business questions, prepared and combined the source tables in Power Query, organized the data model, built the DAX measures and six report pages, and published the result with documentation. The intended value is a clearer analytical workflow; this project does not claim measured commercial impact at a real company.
Start with the overview, then use the report’s left-hand page navigation. No Power BI account is needed to view this public demo.
Preview shown. Load the report to use filters and page navigation.
On a phone, landscape orientation or Open full report gives charts more room. If the frame stays blank, use the direct link above. Read the user guide ↓
For target attainment, keep the customer Region slicer at All. Targets follow the month and sales-agent dimensions; customer-region filtering does not reduce the target in this version. Inventory is a snapshot, and expiry exposure is a screening measure based on the nearest expiry date.
Open a page below to see its actual screenshot, the question it answers, available filters and an example investigation.
Period · Customer region
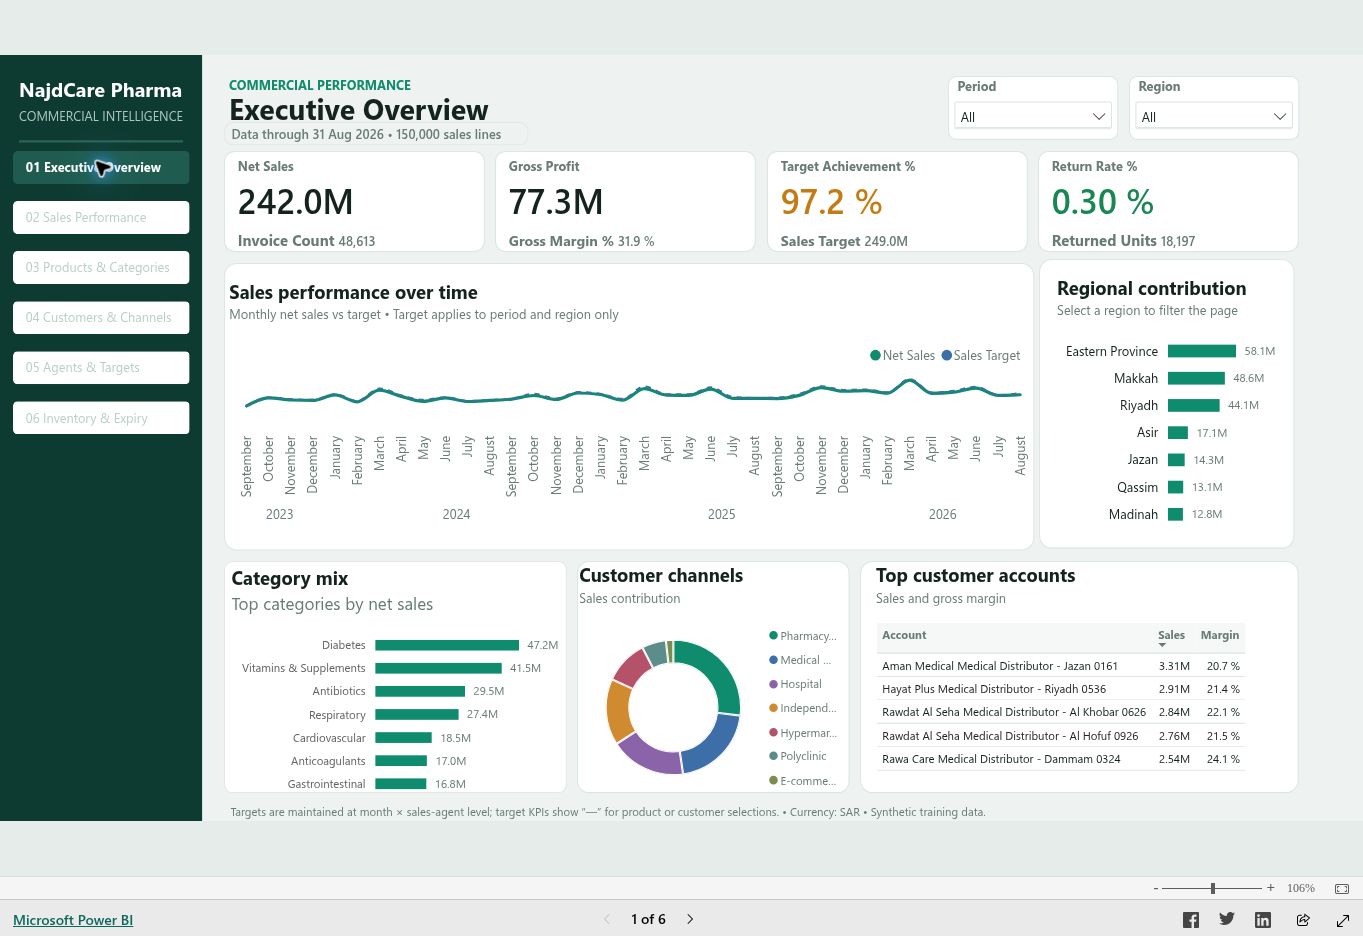
Start with net sales, gross profit, margin, target achievement and the unit return rate. The monthly trend, regional contribution, category mix and customer accounts help identify where to investigate next.
Read the overall baseline, then compare sales and margin across customer regions. For target attainment, keep Region set to All and use the Agents & Targets page for agent-level analysis.
Read with context. The target uses month × sales-agent grain. Customer-region filtering does not reduce the target denominator in this version.
Try it in the live report ↑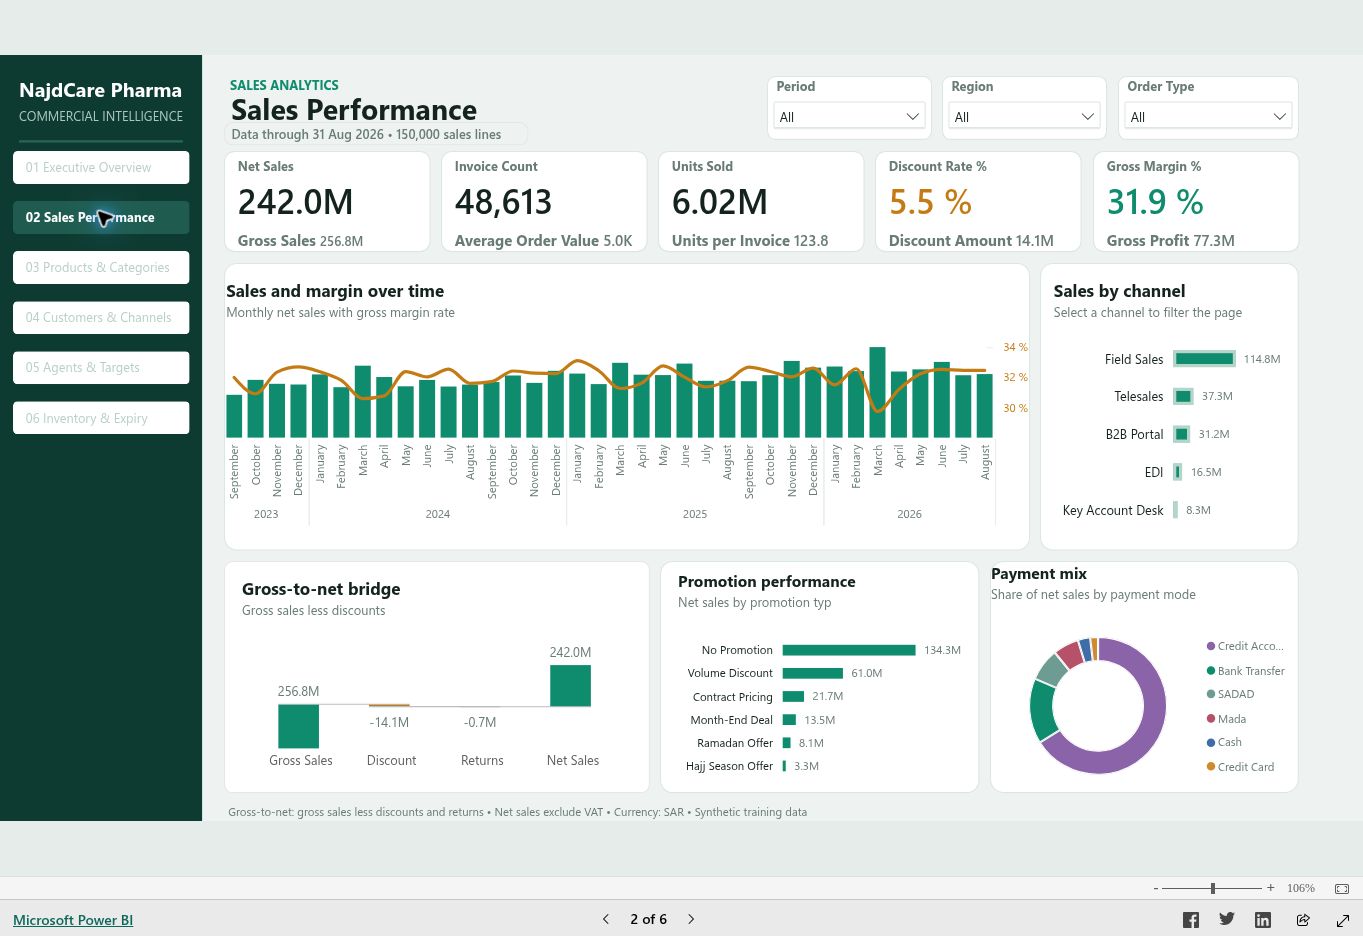
Period · Customer region · Order type
Follow the gross-to-net bridge through discounts and returns, compare monthly sales with margin, and explore sales channels, promotions and payment mix. Invoice count and average order value add transaction context.
Select an order type or channel, inspect its margin as well as revenue, and hover for the supporting measures. Use the bridge to explain why gross sales exceed net sales.
Read with context. Net sales exclude VAT. Promotion comparisons are descriptive; they do not prove the incremental effect of a promotion.
Try it in the live report ↑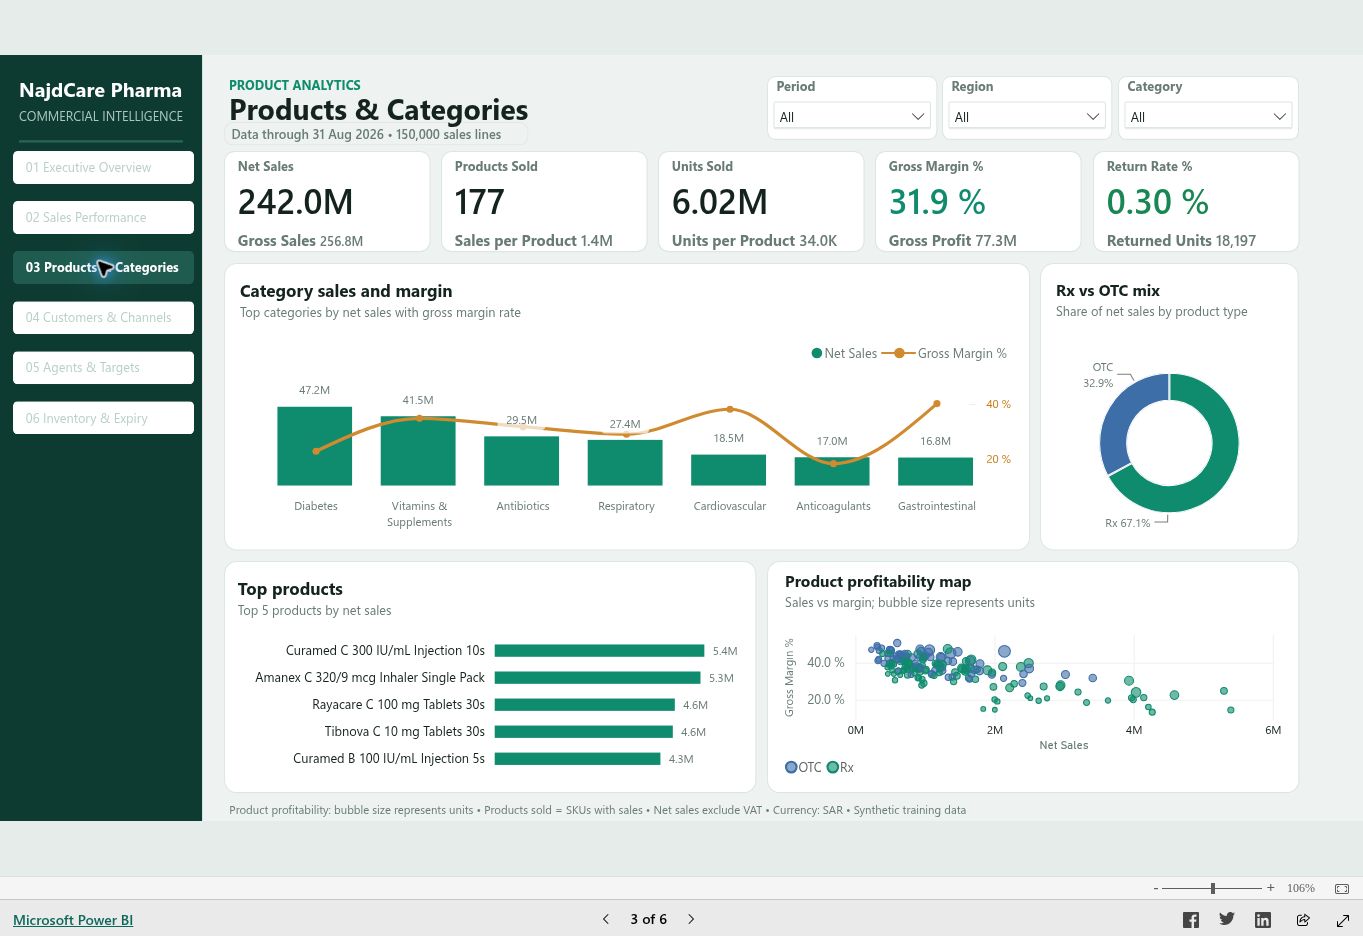
Period · Customer region · Category
Compare category sales and margin, the Rx / OTC mix, the top products and the product profitability map. The map places products by sales and gross margin, with bubble size representing units.
Choose a category, identify a high-revenue product, then examine its margin and return rate. A large sales contribution is a starting point for investigation, not a profitability conclusion.
Read with context. Products Sold counts distinct products with sales in the selected context: 177 in the baseline, from a 180-product master.
Try it in the live report ↑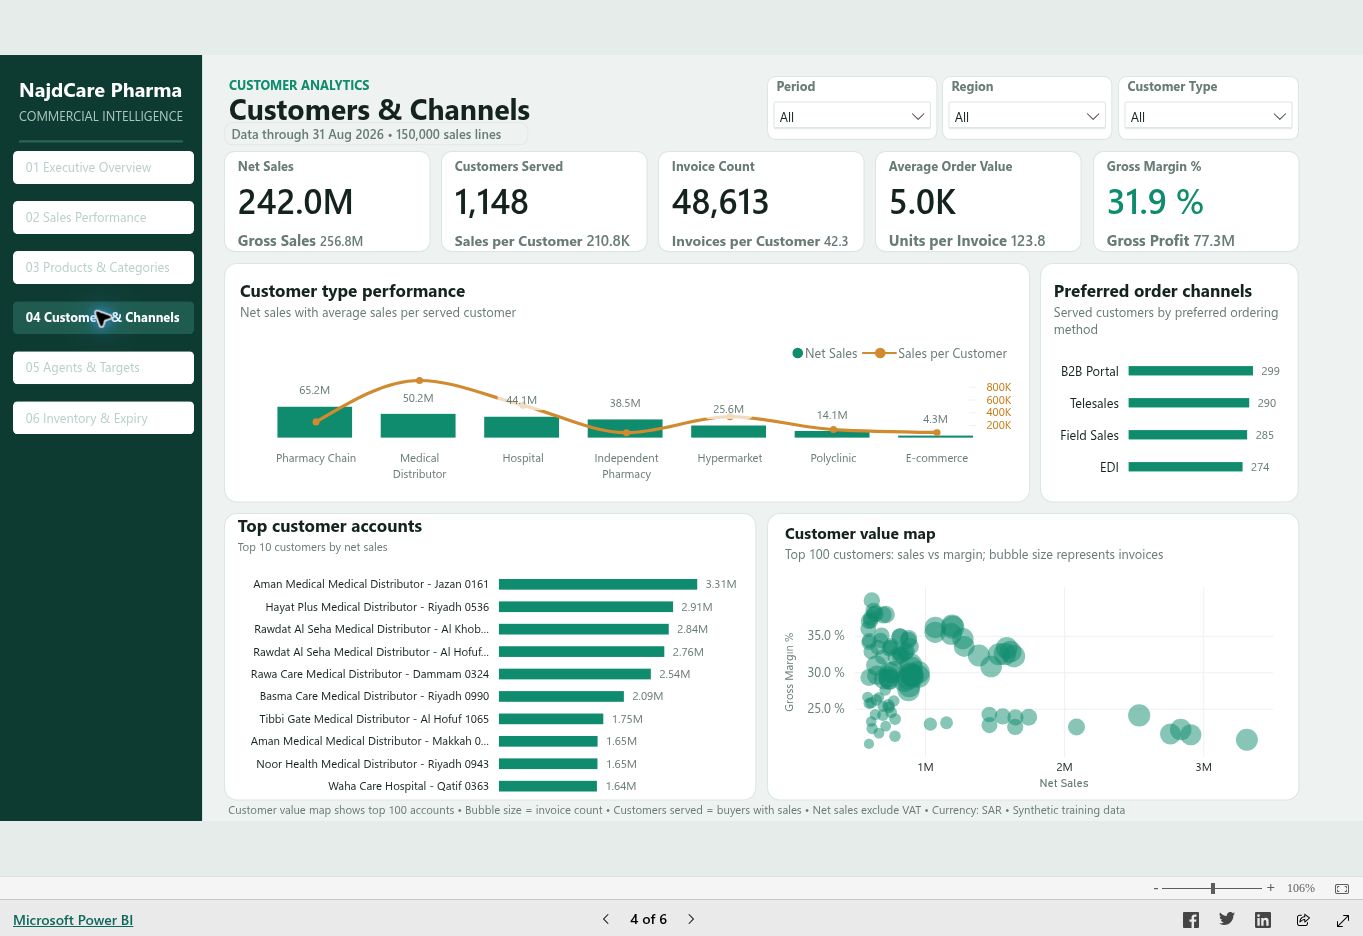
Period · Customer region · Customer type
Review customers served, invoice frequency, order value and margin. Customer-type performance, preferred ordering channels and the top accounts provide complementary views of the customer base.
Choose a customer type, compare revenue with gross margin, and hover over the customer value map to inspect account-level context. Bubble size represents invoice count.
Read with context. The value map shows the top 100 accounts. Preferred order channel is an attribute of the customer; actual sales channel is a transaction attribute on the sales page.
Try it in the live report ↑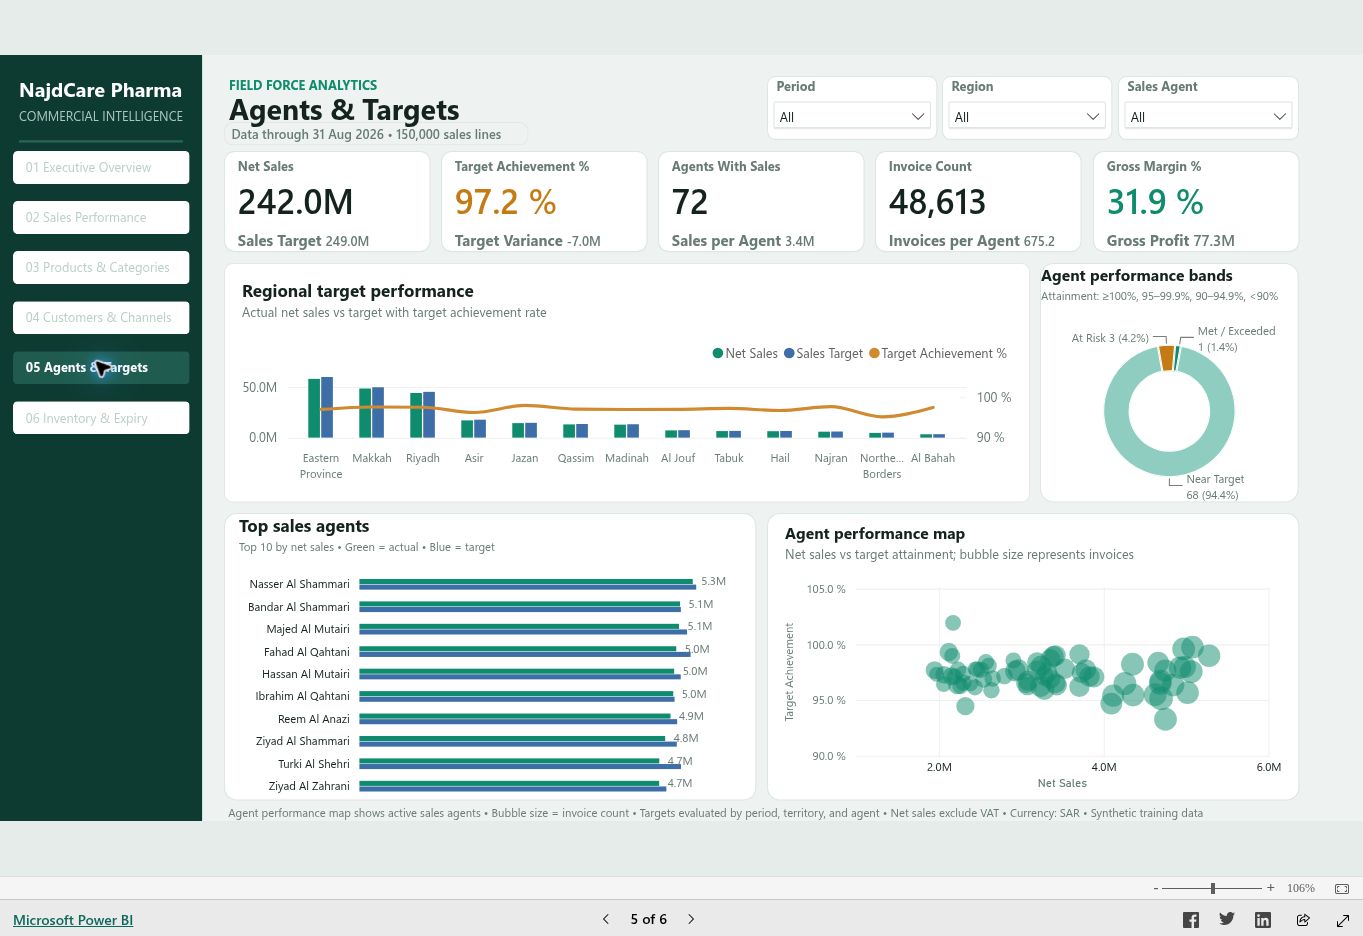
Period · Sales agent · Customer region
Compare actual sales with targets, examine target variance, and explore the regional territory chart, the top agents and the agent performance map. Performance bands distinguish attainment levels.
Keep Region at All, choose a year and a sales agent, and read achievement together with the target variance. Use the territory chart to compare agent territories with a consistent target basis.
Read with context. Bands: ≥100% met / exceeded; 95–<100% near target; 90–<95% at risk; <90% critical. These are project rules, not an industry standard.
Try it in the live report ↑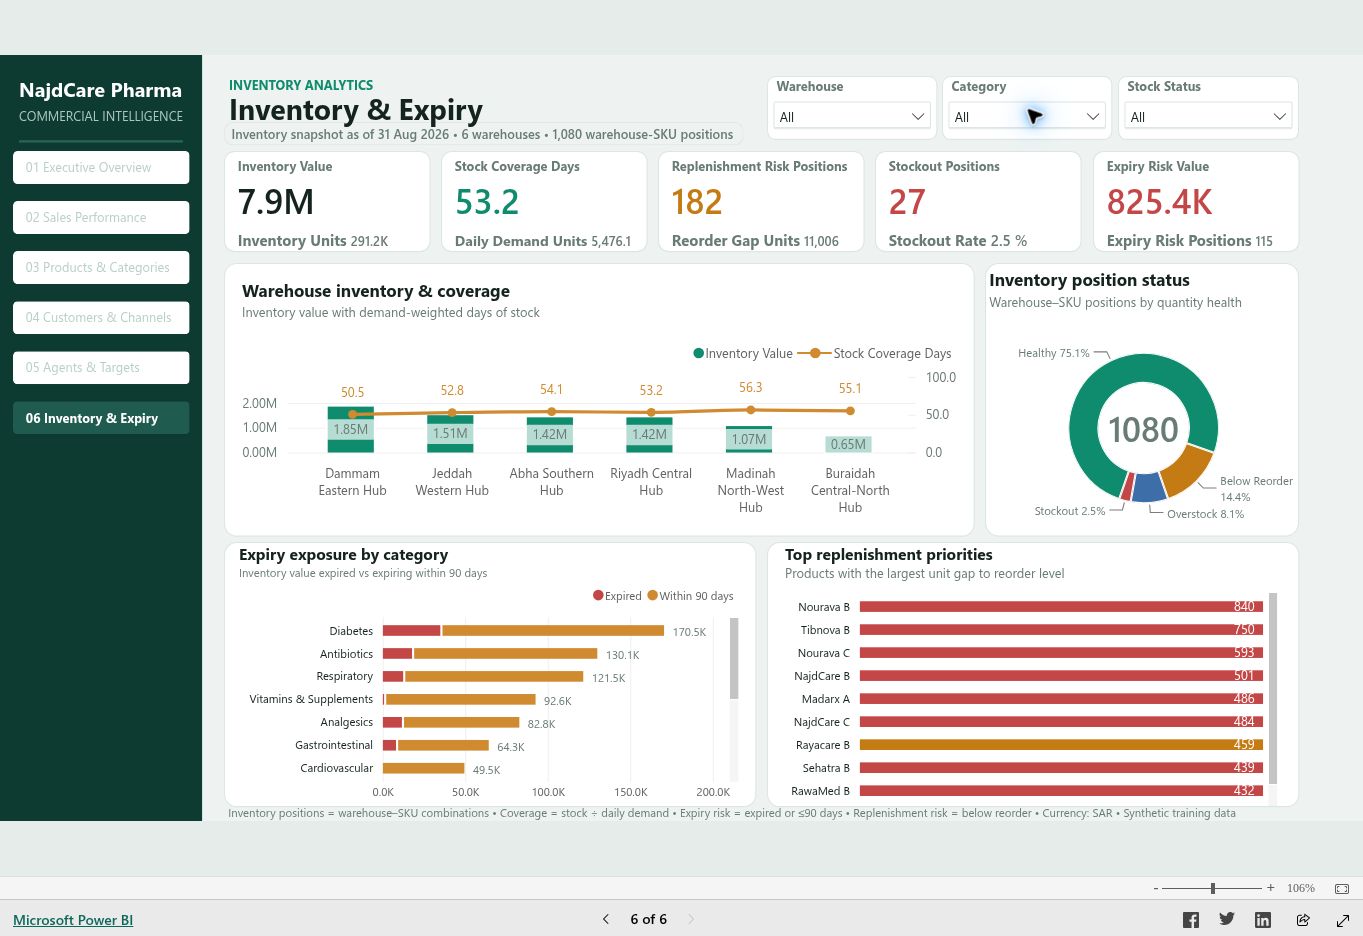
Warehouse · Category · Stock status
Use the inventory snapshot to review stock value, coverage, positions below reorder, stockouts and expiry exposure. Warehouse comparisons, the status mix and replenishment priorities make the next investigation explicit.
Select a warehouse, inspect stockout and below-reorder positions, then compare expiry exposure by category. Open the stock-status filter to focus the review and clear it before returning to the full baseline.
Read with context. This is a snapshot at 31 Aug 2026. Expiry exposure flags the full value of a position whose nearest expiry is within 90 days or already passed; it is not a batch-level write-off estimate.
Try it in the live report ↑Follow this route before experimenting with more detailed selections. Read the selected filters each time you interpret a number.
Load the report and open Executive Overview. Begin with Period and Region at All. The baseline shows approximately SAR 242.0M in net sales, 31.9% gross margin and 97.2% target achievement.
Use Sales Performance for revenue drivers, Products & Categories for product mix, Customers & Channels for account value, Agents & Targets for attainment, or Inventory & Expiry for stock risk.
Use the dropdown slicers at the top. Select a single year or category to narrow the question. Slicers may allow multiple selections; check the displayed selection before comparing results. Inventory uses warehouse, category and stock status instead of the sales period.
On a computer, hover over bars, points or segments for additional values. Selecting a chart element filters or highlights the visuals configured to interact with it. Some comparisons intentionally keep their original context.
Click the selected chart item again to clear a chart selection. For a slicer, use its clear-selection control when available or Select all. The Reset report button above reloads the embedded report at its starting page.
Open Products & Categories → choose a year and category → compare sales with margin → hover over a high-revenue product. Ask whether volume, price or product mix merits further investigation.
Open Agents & Targets → leave Region at All → choose a year and agent → compare actual sales, target achievement and variance. Use the territory chart for a regional target comparison.
Open Inventory & Expiry → choose a warehouse → review stockouts and below-reorder positions → inspect the replenishment chart → clear the status filter before comparing total expiry exposure.
The model keeps transaction-level sales, monthly agent targets and the inventory snapshot distinct so their measures can be interpreted correctly.
Pharma_SalesOne invoice line
150,000sales linesDate · Customer · Product · Agent · Warehouse
Sales_TargetsOne month × one agent
2,592target recordsDate · Agent
InventoryOne warehouse × one SKU
1,080stock recordsProduct · Warehouse · Supplier
Import the synthetic workbook tables, promote headers, set column types and standardize selected display labels. Append the 2023–2026 sales queries into Pharma_Sales.
Connect sales, targets and inventory to the appropriate dimensions. The inspected model contains 11 active many-to-one relationships, all with single-direction filtering.
Use sums, distinct counts, ratio measures, rankings and context checks. The 70 definitions also include labels and conditional-formatting helpers.
Organize six report pages, publish the interactive report to Power BI Service and explain the metric definitions, interpretation rules and snapshot limitations here.
| Dataset | Table | Rows | Grain | Interpretation |
|---|---|---|---|---|
| Sales lines | Pharma_Sales | 150,000 | One invoice line | Date, customer, product, sales agent, warehouse |
| Sales targets | Sales_Targets | 2,592 | One month × one sales agent | Date and sales agent |
| Inventory snapshot | Inventory | 1,080 | One warehouse × one SKU at the snapshot date | Product, warehouse and supplier |
| Products | Linked_Drugs | 180 | One product / SKU | 177 products have recorded sales |
| Customers | Customers | 1,200 | One account | 1,148 have recorded sales; customer geography uses CityID |
| Sales agents | Sales_Agents | 72 | One agent | Agent territory provides the regional target comparison |
| Suppliers / warehouses | Suppliers / Warehouses | 40 / 6 | One supplier / warehouse | Reference data for stock analysis |
| Geography / dates | Geography / Date | 27 / 1,096 | One city / calendar day | Date range: 1 Sep 2023–31 Aug 2026 |
Date filters sales and targets. Product and warehouse dimensions filter both sales and inventory. Sales agents filter sales and targets. Customer geography filters customers and then sales; suppliers filter inventory.
Targets are not allocated to individual products or customers. The validity measure returns blank for its explicitly checked product or customer selections. The separate customer-geography slicer is not included in that protection, so leave it at All for target comparisons.
Inventory is a point-in-time position, not a movement ledger. It is not linked to the sales date dimension. A sales-year selection should not be interpreted as historical inventory.
| Dimension key | Related key |
|---|---|
| Date.DateKey | Pharma_Sales.DateKey |
| Date.DateKey | Sales_Targets.TargetMonthDateKey |
| Customers.CustomerID | Pharma_Sales.CustomerID |
| Linked_Drugs.DrugID | Pharma_Sales.DrugID |
| Sales_Agents.SalesAgentID | Pharma_Sales.SalesAgentID |
| Warehouses.WarehouseID | Pharma_Sales.WarehouseID |
| Geography.CityID | Customers.CityID |
| Linked_Drugs.DrugID | Inventory.DrugID |
| Suppliers.SupplierID | Inventory.SupplierID |
| Warehouses.WarehouseID | Inventory.WarehouseID |
| Sales_Agents.SalesAgentID | Sales_Targets.SalesAgentID |
Baseline values below use all available sales data or the full inventory snapshot. Report cards may round these values. K = thousand; M = million.
| Metric | Logic | How to interpret it | Baseline |
|---|---|---|---|
| Net sales | Σ NetSalesExclVATSAR | Sales after discounts and returns, excluding VAT. The main revenue measure. | SAR 241,967,508.82 |
| Gross sales | Σ GrossSalesSAR | Revenue before discounts and returns. | SAR 256,789,996.85 |
| Gross profit | Σ GrossProfitSAR | Stored gross profit summed across the selected sales lines. It is not net profit. | SAR 77,293,391.47 |
| Gross margin | Gross profit ÷ net sales | A ratio of totals; do not average row-level margin percentages. | 31.94% |
| Invoice count | Distinct InvoiceNumber | Unique invoices, not the number of sales lines. | 48,613 |
| Average order value | Net sales ÷ invoice count | Average revenue per invoice in the selected context. | SAR 4,977.42 |
| Discount rate | Discount amount ÷ gross sales | Share of gross revenue given as discounts. | 5.49% |
| Return rate | Returned units ÷ units sold | A unit-based return rate, not returned value divided by revenue. | 0.30% |
| Products sold / customers served | Distinct IDs in Pharma_Sales | Counts activity in the selected period, not all master-data records. | 177 products / 1,148 buyers |
| Target achievement | Net sales ÷ sales target | Compare at compatible period and sales-agent / territory scope. | 97.18% |
| Target variance | Net sales − sales target | A negative amount means sales are below target. | −SAR 7,019,083.84 |
| Inventory value | Σ InventoryValueSAR | Value held in the selected warehouse–SKU positions at the snapshot date. | SAR 7,920,403.77 |
| Stock coverage | Stock units ÷ average daily demand units | Demand-weighted coverage across the selected positions; not an average of individual coverage ratios. | 53.18 days |
| Replenishment risk | Count positions with stock < reorder level | Includes positions with zero stock. Count positions, not distinct products. | 182 positions |
| Reorder gap | Σ max(reorder level − stock, 0) | Units required to reach the recorded reorder levels. It is not a complete purchase-order recommendation. | 11,006 units |
| Stockout rate | Zero-stock positions ÷ eligible positions | The denominator removes the Stock Status filter, while retaining the other applicable filters. | 27 / 1,080 = 2.50% |
| Expiry exposure | Value where stock > 0 and nearest expiry ≤90 days | Includes expired stock positions and those expiring within 90 days. Flags full position value, not batch-level losses. | SAR 825,385.46 / 115 positions |
Gross Margin % =
DIVIDE ( [Gross Profit], [Net Sales] )
This preserves the weighted margin of the selected sales, instead of averaging line percentages.
Invoice Count =
DISTINCTCOUNT ( Pharma_Sales[InvoiceNumber] )
Multiple invoice lines still represent one invoice.
Stock Coverage Days =
DIVIDE ( [Inventory Units], [Daily Demand Units] )
The result uses the total selected stock and demand, so high-demand positions carry the appropriate weight.
These observations describe the synthetic, unfiltered project snapshot. Suggested actions are analytical next steps, not outcomes delivered to a real business.
Net sales of SAR 241.97M sit below the SAR 248.99M target, a shortfall of SAR 7.02M.
SAR 14.10M of discounts and SAR 0.73M of returns explain the difference between gross and net sales.
182 warehouse–SKU positions are below reorder, including 27 stockouts. The total gap to the recorded reorder levels is 11,006 units.
115 positive-stock positions have a nearest expiry within 90 days or already passed. Their full recorded stock value is flagged.
A useful portfolio explains what was checked and where further work would improve the solution.
These checks cover the stored snapshot and selected interactions; they are not an exhaustive certification of every DAX context or reporting scenario.
No. It is a synthetic training dataset for a fictional Saudi pharmaceutical distributor. The project demonstrates analytical methods and business interpretation, not the actual performance of Aldawaa or any other employer.
The report includes validity checks for specific product and customer selections. A dash means the target comparison is not provided in that context. It should not be interpreted as zero. This protection does not cover every possible filter; see the target guidance above.
The coverage labels deliberately remove filters to describe the full dataset and snapshot. The KPI values still respond to their applicable filters.
Yes. The public report uses its desktop canvas in this web embed. Use landscape orientation or open the full report for more space. The surrounding case study, page screenshots and guide adapt to smaller screens.
The metric dictionary explains the main measures, the data-model section lists relationships and grain, and the linked DAX reference contains all 70 measure expressions from the project source.
Pharmacy experience. Business questions. Analytical work.
I am open to Data Analyst, BI Analyst, Reporting Analyst and healthcare / retail analytics opportunities.