
Returns are the customer's right
Scoring pharmacists on returns would push them to refuse returns. So returns were removed from the branch score.
Flagship · Microsoft Fabric · Completed
A pharmacy chain with 1,000 branches sold more every year, yet it kept losing money. I traced the data from the cash register to the dashboard and found where the money goes: 314 products that cost more to buy than they sell for.
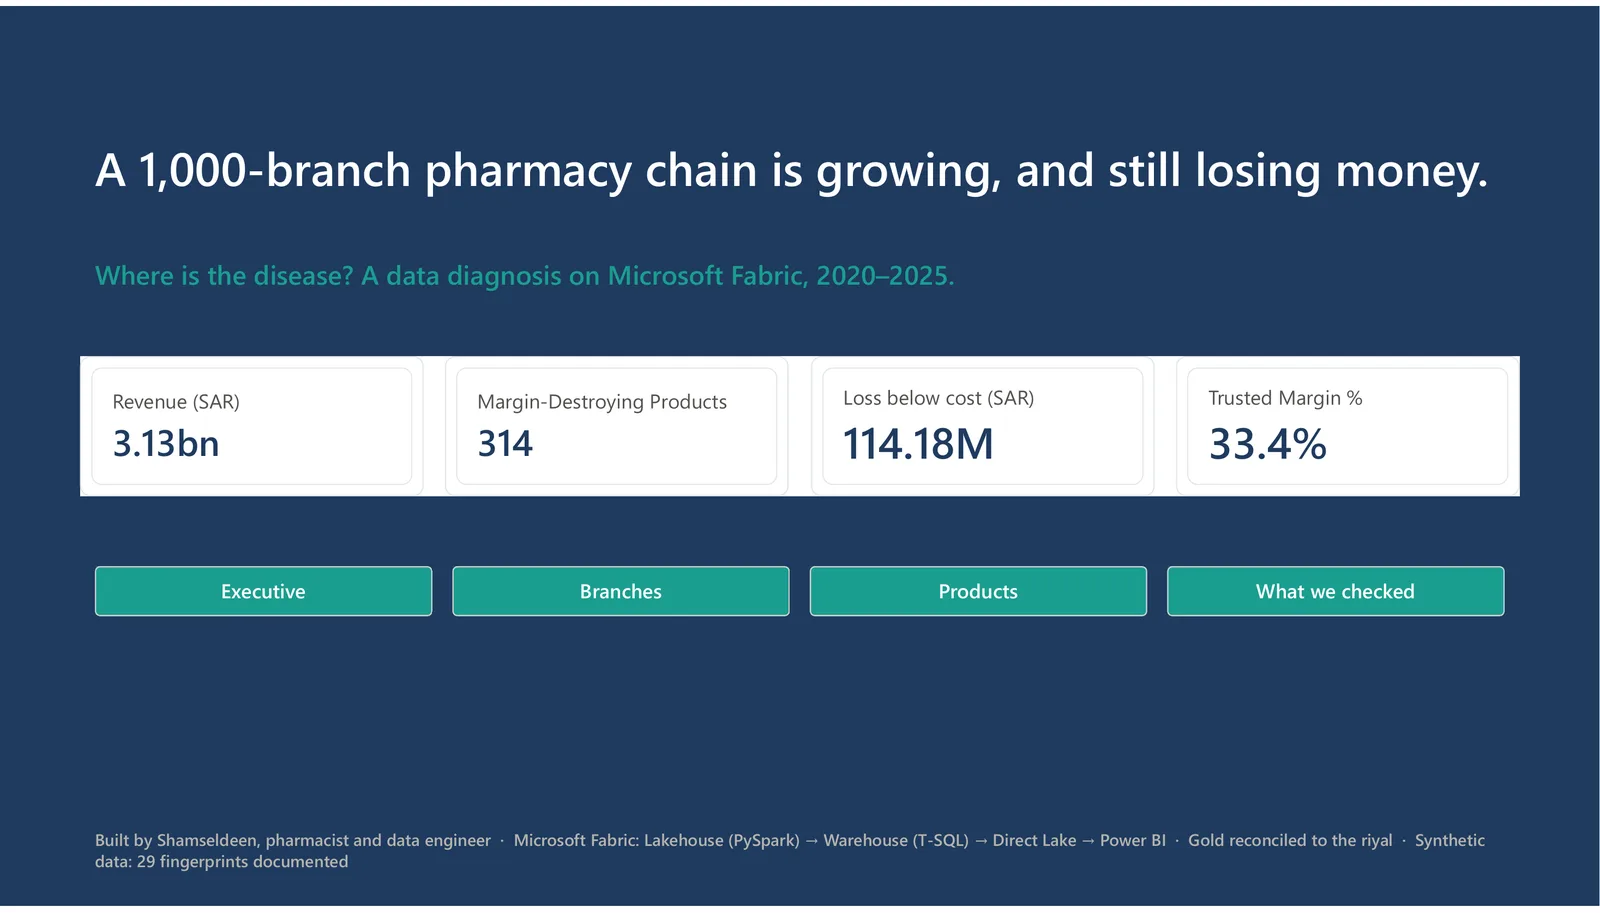
The analyst examines each part of the business, removes the healthy ones, and points at the disease. The manager decides what to do.
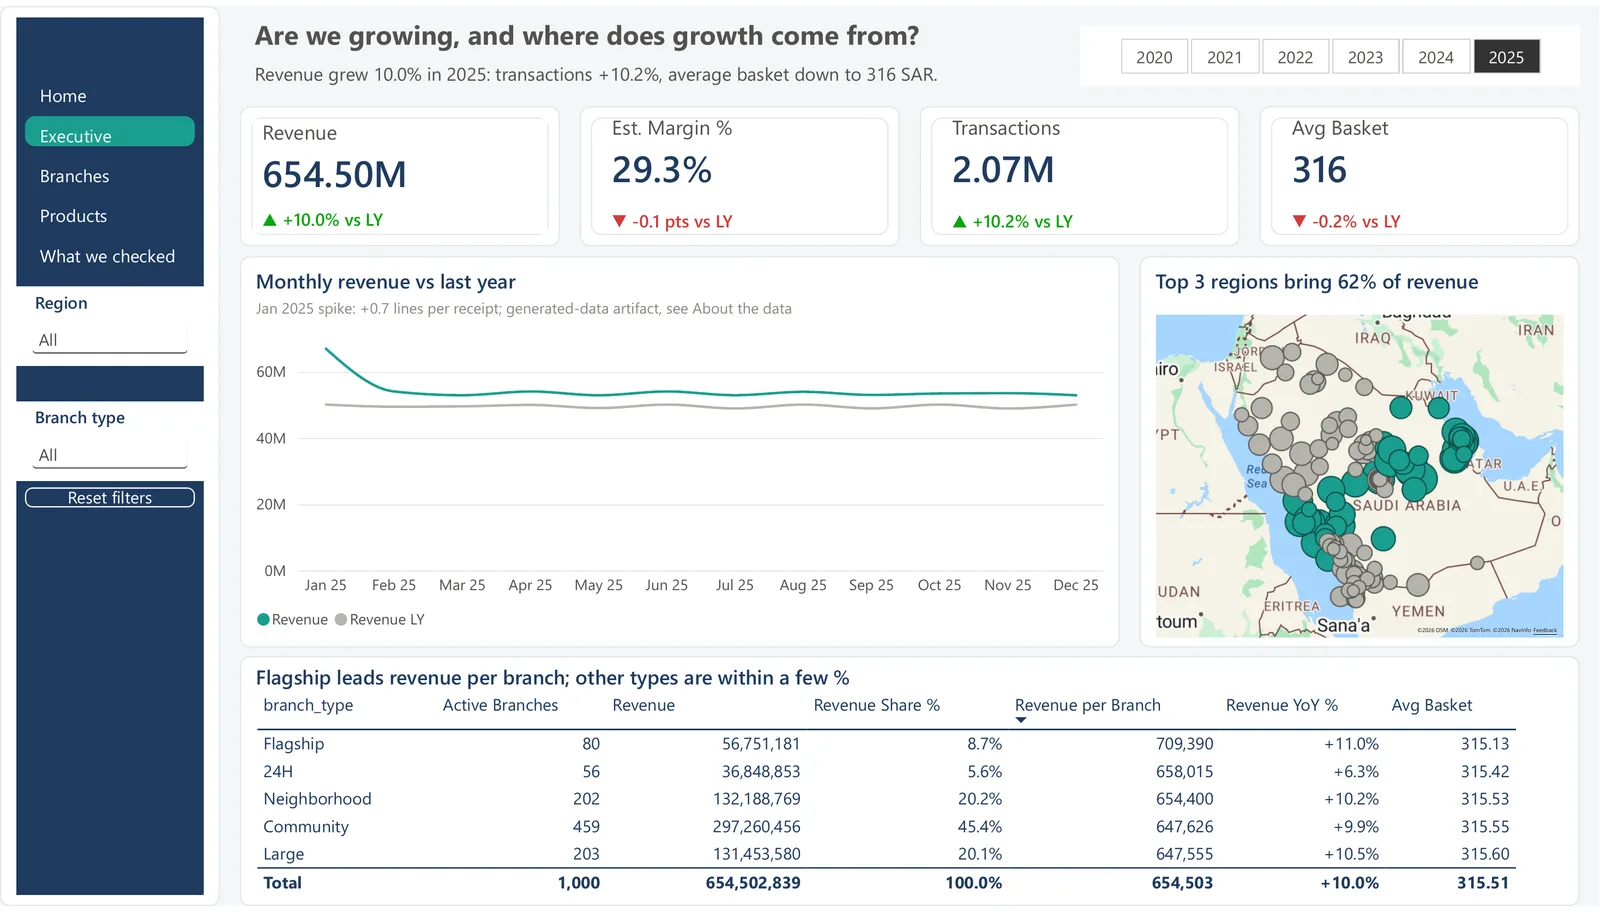
Sales rise every year, in every region and branch type. Nothing on this page looks wrong, which is exactly why the problem was hard to find.
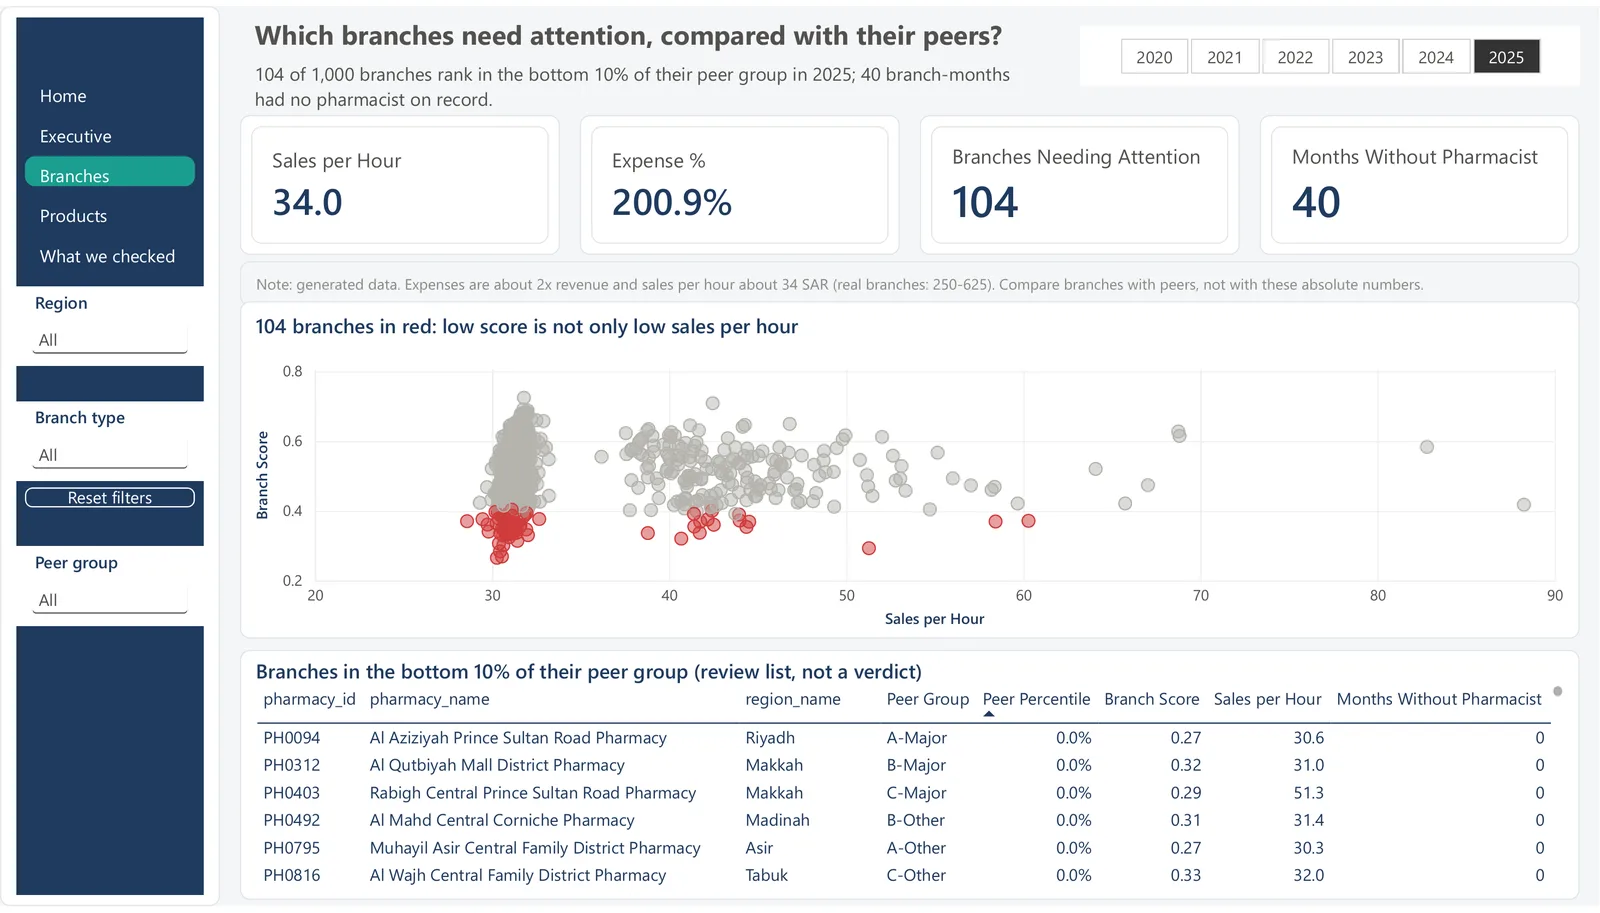
Each branch is compared only with similar branches (same size and city type). The weakest 10% appear in red, as a list to review, not to punish. Click a branch to open its own profile.
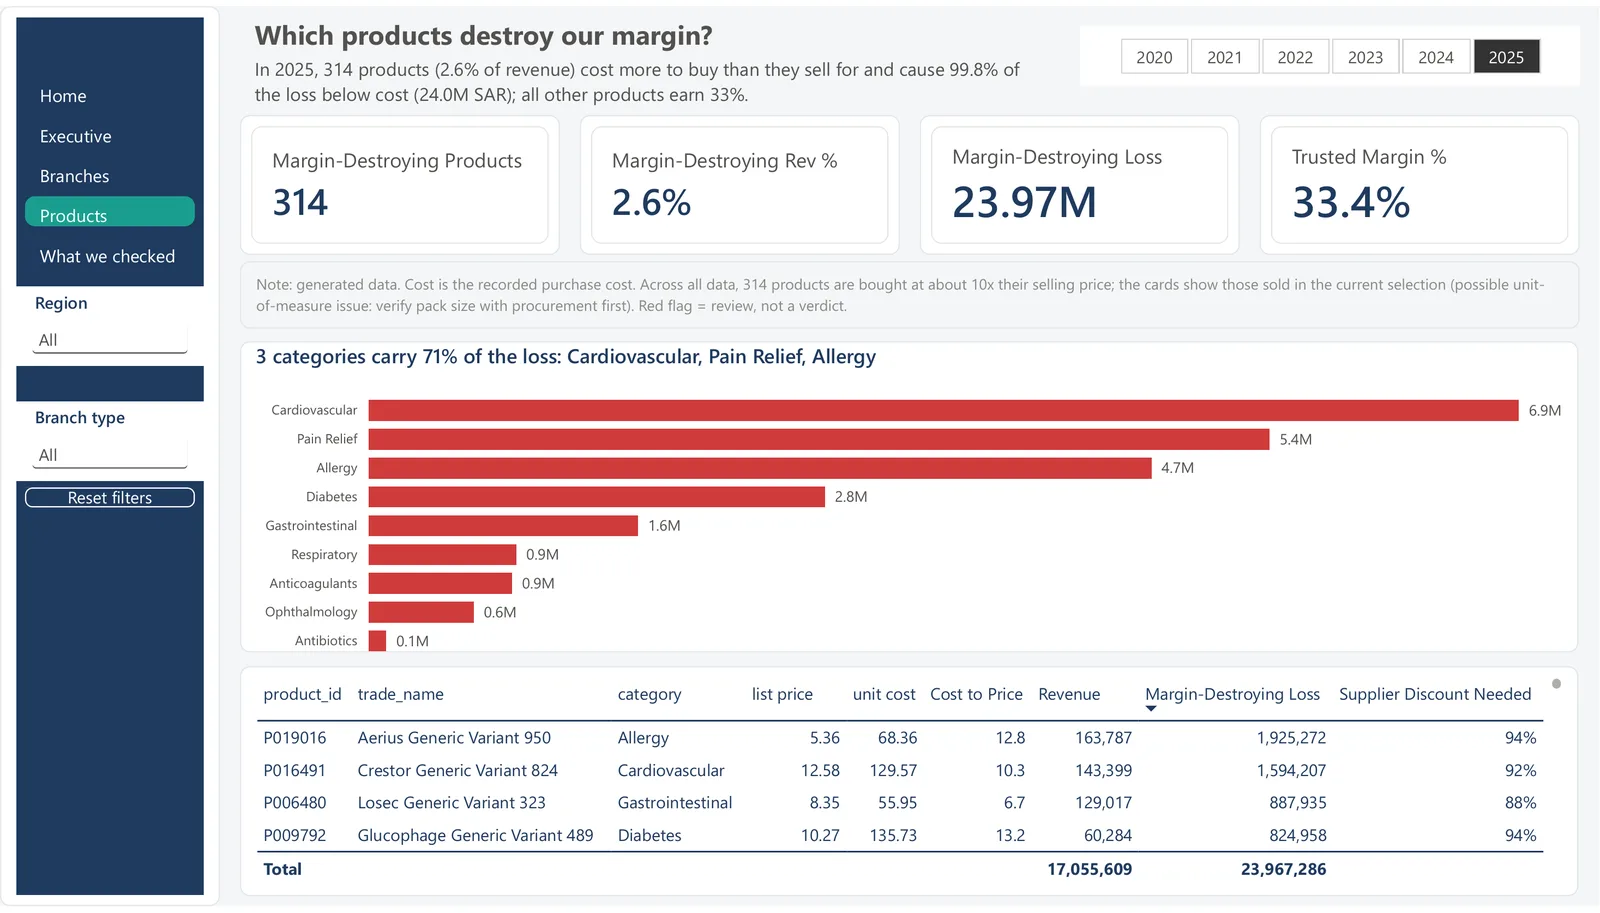
These products are 2.6% of sales but cause almost all of the loss. For each one, the report shows the discount the supplier would need to give for a 20% margin: often above 90%. The decision becomes simple: renegotiate, check the pack size, or stop buying.
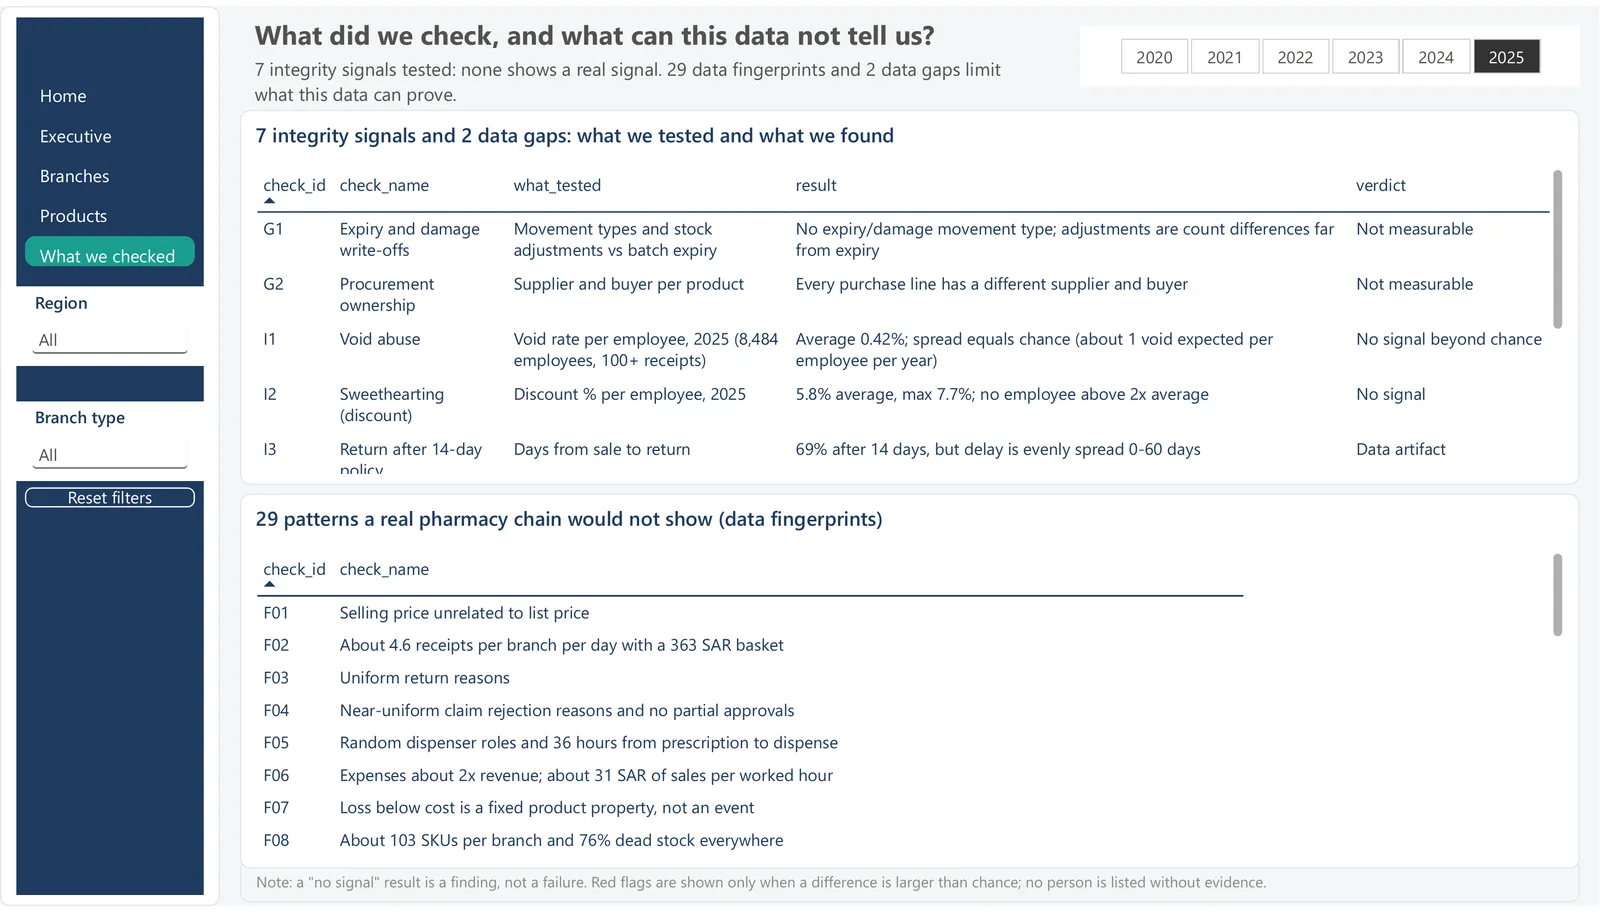
Before blaming any person, the analysis tested seven common fraud patterns. None was stronger than chance, so nobody is named. The real gap is a missing control: nothing stops a product being bought above its selling price.
Sales were growing, branches were working, and the company was still bleeding. The disease was not where everyone was looking.
Five actions in order of urgency. The analyst recommends; the manager decides.
Freeze new purchase orders for the 314 products. First check the pack size with procurement: a cost about 10x the price often means a box was recorded against a single strip.
For each product the report shows the supplier discount needed for a 20% margin. If the supplier cannot reach it, delist the product, unless it is an essential chronic medicine with no alternative; then keep it and offer a therapeutic substitute.
Block any purchase order whose cost is above the selling price without a manager's approval. Ask for three quotes, separate who orders from who approves, and review a monthly exception report.
Visit the red branches with their peer comparison in hand. Start with expenses, the main driver of low scores, not sales. Never score pharmacists on customer returns.
Log expiry and damage write-offs with a reason, give each product one owner in procurement, and store monthly branch targets. Then the next diagnosis can measure what this one could not.
If the 314 products stop selling at a loss, the 2025 margin rises from 29.3% to about 33%, the level every other product already earns. That is up to 24M SAR a year (estimate on synthetic data).
Ten years in retail pharmacy shaped what the report measures, and what it refuses to measure.
Scoring pharmacists on returns would push them to refuse returns. So returns were removed from the branch score.
Expiry and damage matter most, but the data has no write-off records. The report says so instead of faking an indicator.
Buyers of the loss-making products behave like all other buyers. The finding is a process gap, not a person.
An average that was exactly 0.40 instead of 0.50 led to a real error in the data layer. It was fixed before publishing.
End-to-end on Microsoft Fabric, with every layer reconciled to the riyal and stored in Git.
72 source tables, 60,234,021 rows, reconciled to the raw files with a difference of 0.
58 tables with keys, types, money as decimal(18,2) and business-rule checks.
Star schema: 9 dimensions, 9 facts, 4 analytical tables. 23 stored procedures rebuild everything in about 2 minutes.
Measures written in TMDL, 6 pages, dynamic titles, drill-through, performance under 2 s per visual.
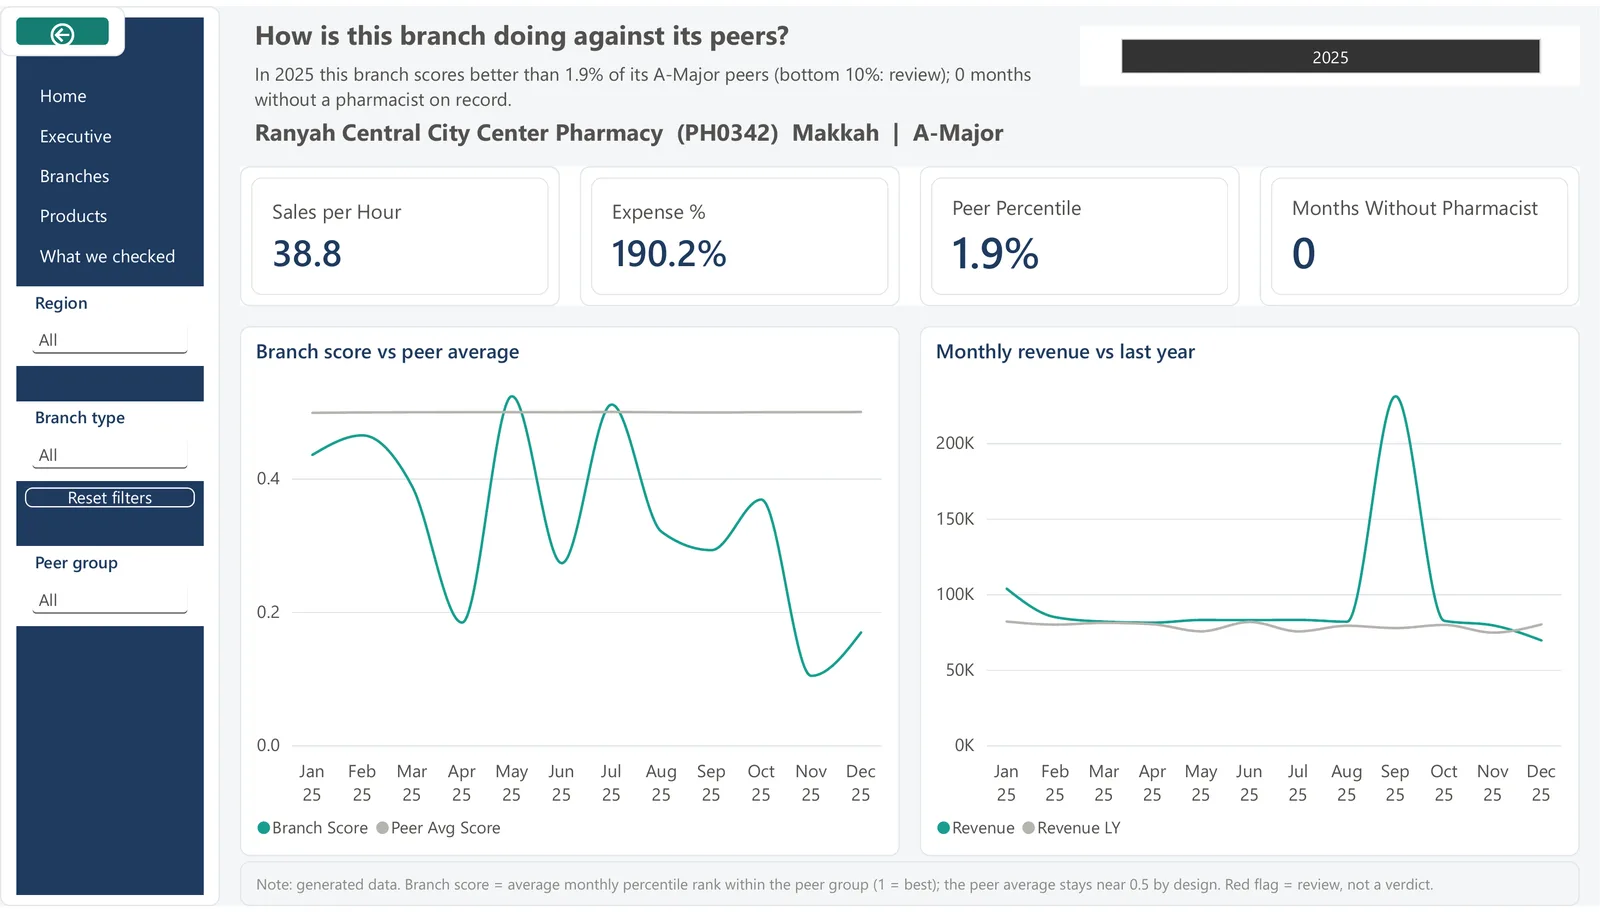
Right-click any red branch, choose Drill through, and see when its score dropped and how its sales moved.
No. It is a synthetic dataset of a fictional Saudi pharmacy chain. The report lists 29 patterns where the data does not behave like a real chain, instead of hiding them.
The report runs on a Microsoft Fabric capacity. The screenshots above are exported directly from it; the code to rebuild everything is on GitHub.
Pharmacist · Junior Data Engineer & Data Analyst
Open to Junior Data Engineer, Data Analyst and BI roles in healthcare and retail.