
Python · التحليل الكامل · مراجعة سبتمبر 2026
فيتامين C والسعرات.
من السؤال إلى الدليل.
أي فاكهة أعلى تركيزًا في فيتامين C؟ تتصدر الأسيرولا النيئة فئة الفواكه في هذه البيانات بتركيز 1,677.6 ملغ لكل 100 غرام. استكشف الترتيب وتجهيز البيانات وعلاقة الماء بالطاقة ونماذج السعرات المراجعة، مع كود Python بجوار النتائج.
انتقل إلى نتيجة فيتامين C والكود المصحح ←
متاح للجميع · دون تسجيل دخول
غذاء واحد في كل صف، ومقارنة لكل 100 غرام.
عُدلت بيانات مسابقة DataCamp من USDA FoodData Central. تضم 12 عمودًا: معرّف الغذاء ووصفه وفئته وتسعة حقول للعناصر الغذائية أو الطاقة. أسماء الأغذية أدناه محفوظة كما وردت في المصدر.
| الغذاء | الفئة | الطاقة (كيلو سعر) | الماء (غرام) |
|---|---|---|---|
| Pillsbury Golden Layer Buttermilk Biscuits, Artificial Flavor, refrigerated dough | Baked Products | 307.0 | 35.5 |
| Pillsbury, Cinnamon Rolls with Icing, refrigerated dough | Baked Products | 330.0 | 27.9 |
| Kraft Foods, Shake N Bake Original Recipe, Coating for Pork, dry | Baked Products | 377.0 | 3.2 |
| George Weston Bakeries, Thomas English Muffins | Baked Products | 232.0 | 42.6 |
| Waffles, buttermilk, frozen, ready-to-heat | Baked Products | 273.0 | 40.3 |
عرض أعداد الأغذية في الفئات الـ25
| الفئة | عدد الأغذية |
|---|---|
| American Indian/Alaska Native Foods | 165 |
| Baby Foods | 345 |
| Baked Products | 517 |
| Beef Products | 954 |
| Beverages | 366 |
| Breakfast Cereals | 195 |
| Cereal Grains and Pasta | 181 |
| Dairy and Egg Products | 291 |
| Fast Foods | 312 |
| Fats and Oils | 216 |
| Finfish and Shellfish Products | 264 |
| Fruits and Fruit Juices | 355 |
| Lamb, Veal, and Game Products | 464 |
| Legumes and Legume Products | 290 |
| Meals, Entrees, and Side Dishes | 81 |
| Nut and Seed Products | 137 |
| Pork Products | 336 |
| Poultry Products | 383 |
| Restaurant Foods | 109 |
| Sausages and Luncheon Meats | 167 |
| Snacks | 176 |
| Soups, Sauces, and Gravies | 254 |
| Spices and Herbs | 63 |
| Sweets | 358 |
| Vegetables and Vegetable Products | 814 |
تحويل الوحدات مع الحفاظ على القيم المفقودة.
تُستخرج القيم الرقمية من نصوص مثل 5.88 g و307.0 kcal. تبقى القيم غير المسجلة مفقودة، وتختار كل عملية الأعمدة التي تحتاجها فقط، بدل حذف أي صف ينقصه أي حقل.
| الحقل | صفوف بقيم مفقودة | نسبتها من كل الأغذية |
|---|---|---|
| الكحول | 2,394 | 30.7% |
| الألياف | 562 | 7.2% |
| فيتامين C | 461 | 5.9% |
| الكوليسترول | 399 | 5.1% |
لا توجد قيم مفقودة للسعرات أو البروتين أو الكربوهيدرات أو الدهون أو الماء في هذه البيانات.
افتح كود التنظيف الفعلي
names={'Calories':'calories','Protein':'protein','Carbohydrate':'carb','Total fat':'fat','Cholesterol':'cholesterol','Fiber':'fiber','Water':'water','Alcohol':'alcohol','Vitamin C':'vitamin_c'}
data=raw[['FDC_ID','Item','Category']].copy()
for src,dst in names.items():
    data[dst]=pd.to_numeric(raw[src].astype('string').str.extract(r'^\s*([-+]?\d+(?:\.\d+)?)',expand=False),errors='coerce')
# Missing values stay missing; no unverified assumption that missing means zero.
missing=data[list(names.values())].isna().sum().to_dict()ماذا تُظهر سجلات الأغذية؟
ماء أكثر وكثافة طاقة أقل
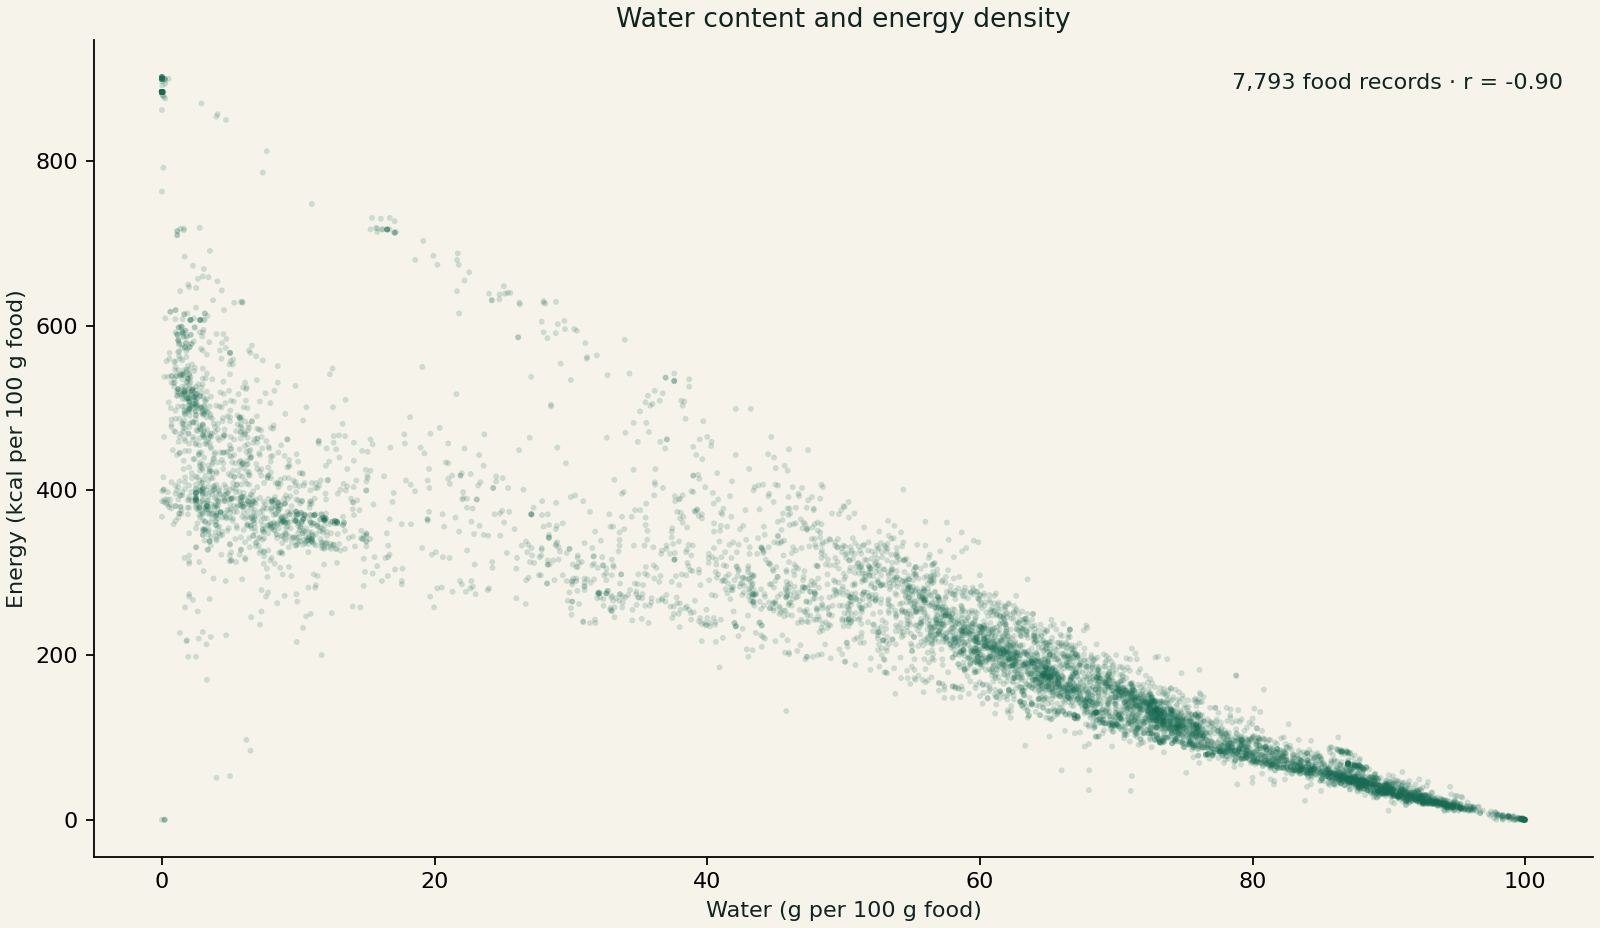
عبر 7,793 غذاءً، يبلغ معامل ارتباط بيرسون بين الماء والسعرات −0.895. يصف ذلك ارتباطًا عكسيًا قويًا داخل البيانات على أساس 100 غرام.
أي الفواكه أعلى في فيتامين C ضمن هذه البيانات؟
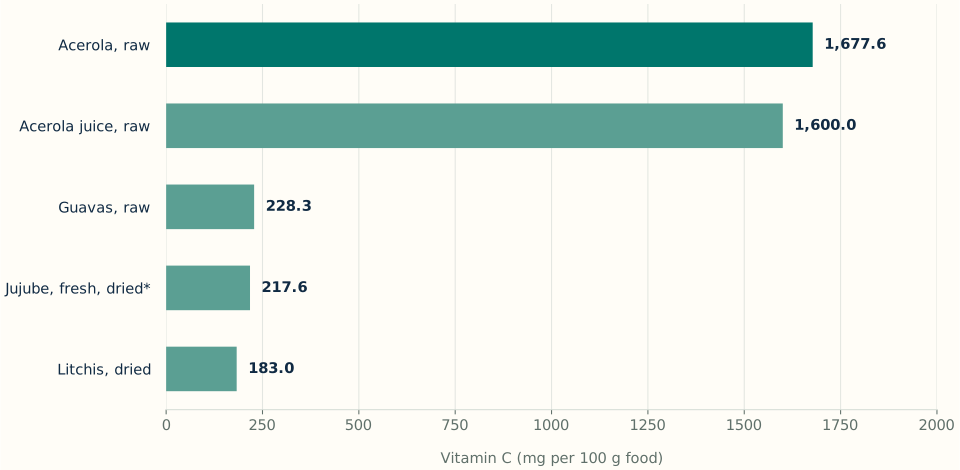
تأتي الأسيرولا النيئة أولًا ضمن فئة الفواكه وعصائر الفواكه: 1,677.6 ملغ لكل 100 غرام. تتشارك الأغذية الطازجة والعصائر والمجففة أساس الكتلة نفسه، لكنها أشكال غذائية مختلفة.
| اسم الغذاء في المصدر | فيتامين C (ملغ / 100 غرام) |
|---|---|
| Acerola, (west indian cherry), raw | 1,677.6 |
| Acerola juice, raw | 1,600.0 |
| Guavas, common, raw | 228.3 |
| Jujube, Chinese, fresh, dried | 217.6 |
| Litchis, dried | 183.0 |
يشمل الترتيب 349 سجلًا من أصل 355 في فئة الفواكه؛ تُستبعد السجلات الست ذات القيمة المفقودة لفيتامين C من هذا الحساب فقط. أسقطت الطباعة الأصلية الجزء العشري وأظهرت 1,677. تحافظ النتيجة المصححة على دقة المصدر: 1,677.6 ملغ لكل 100 غرام.
هذا ترتيب داخل مجموعة البيانات، ولا يشمل جميع فواكه العالم. تختلف الأغذية الطازجة والعصائر والمجففة؛ توحيد الكتلة لا يعني توحيد الحصة المعتادة ولا يمثل توصية سريرية.
افتح كود فيتامين C المصحح
"""Reproduce the fruit vitamin C result. Run beside nutrition.csv."""
import pandas as pd

# Reload the source so earlier notebook zero-filling cannot affect this result.
vitamin_c_source = pd.read_csv("nutrition.csv")
vitamin_c_source["Vitamin C_mg"] = pd.to_numeric(
    vitamin_c_source["Vitamin C"].astype("string").str.extract(
        r"^\s*([-+]?\d+(?:\.\d+)?)", expand=False
    ), errors="coerce"
)

# Only missing vitamin C excludes a fruit from this ranking.
df_foodFruit = vitamin_c_source.loc[
    vitamin_c_source["Category"].eq("Fruits and Fruit Juices")
].copy()
fruit_missing = int(df_foodFruit["Vitamin C_mg"].isna().sum())
eligible_fruits = df_foodFruit.dropna(subset=["Vitamin C_mg"])
if eligible_fruits.empty:
    raise ValueError("No fruit records with a reported vitamin C value.")

# Keep every tied maximum and preserve the decimal precision.
ConcVitC = float(eligible_fruits["Vitamin C_mg"].max())
df_foodFruit_HvitC = eligible_fruits.loc[
    eligible_fruits["Vitamin C_mg"].eq(ConcVitC)
]
itemFruitHC = df_foodFruit_HvitC["Item"].tolist()
print(f"Ranked {len(eligible_fruits)} of {len(df_foodFruit)} fruit records; "
      f"excluded {fruit_missing} with missing vitamin C.")
for food_name in itemFruitHC:
    print(f"Highest recorded fruit vitamin C: {food_name} — "
          f"{ConcVitC:,.1f} mg per 100 g.")
print("Scope: Fruits and Fruit Juices in this dataset; product forms vary.")

Top10Fruit = eligible_fruits.nlargest(10, "Vitamin C_mg")
print(Top10Fruit[["Item", "Vitamin C_mg"]].to_string(index=False))
استكشف سؤال المجموعات الغذائية الأصلي
تعود هذه المقارنة إلى سؤال المجموعات الغذائية في الدفتر الأصلي. الغذاء الذي سُجلت له كربوهيدرات صفرية لا يمثل نظامًا غذائيًا كاملًا. المتوسطات غير مرجّحة بين السجلات، وتُستبعد قيم الكوليسترول المفقودة من متوسطه مع توضيح عدد القيم المتاحة.
| المجموعة | الصفوف | متوسط السعرات | متوسط الدهون (غ) | متوسط الكوليسترول (ملغ) | قيم الكوليسترول المتاحة |
|---|---|---|---|---|---|
| جميع الأغذية | 7,793 | 220.2 | 10.7 | 45.0 | 7,394 |
| الأغذية ذات الكربوهيدرات الصفرية | 2,138 | 233.6 | 15.6 | 95.7 | 2,087 |
| أعلى 500 غذاء في البروتين | 500 | 242.7 | 9.7 | 99.6 | 493 |
جميع المتوسطات لكل 100 غرام. هذه مجموعات متداخلة واختيارات وصفية؛ لا تثبت فوائد أو أضرار الأنظمة الغذائية أو خطر الإصابة بالأمراض.
تنزيل المقارنة CSVتقييم كل نموذج على الأغذية نفسها.
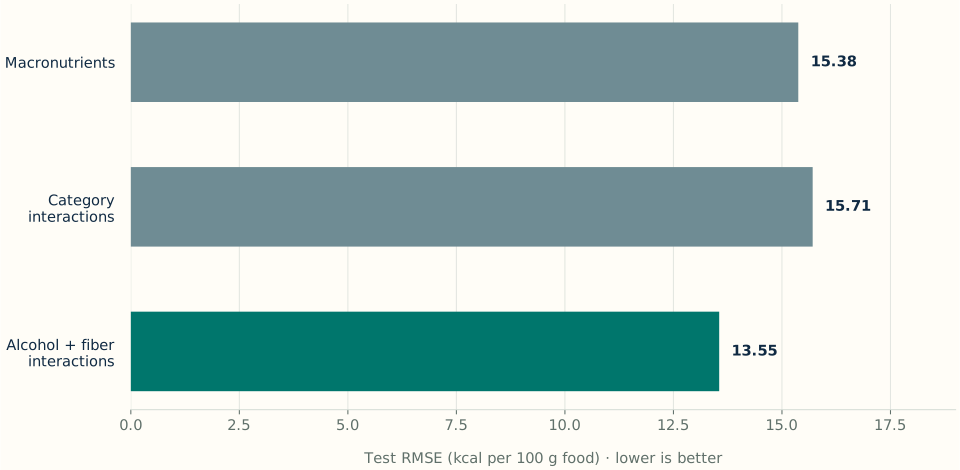
يعطي النموذج الأصلي للعناصر الغذائية الكبرى، دون ثابت انحدار، معاملات 4.137 كيلو سعر/غ للبروتين و8.844 للدهون و3.854 للكربوهيدرات عند إعادة حسابه على جميع الصفوف ذات السعرات الموجبة. تستخدم المقارنة التالية عينة تقييم مشتركة منفصلة.
- 1. الصفوف المؤهلة نفسها
5,334 غذاءً بسعرات موجبة وقيم مكتملة للبروتين والدهون والكربوهيدرات والكحول والألياف.
- 2. تقسيم ثابت
بذرة عشوائية 42 ونحو 20% من كل فئة للاختبار: 4,278 صفًا للتدريب و1,056 للاختبار.
- 3. مقارنة أخطاء الاختبار
تُقدّر المعاملات من صفوف التدريب فقط، ثم يُحسب MAE وRMSE على صفوف الاختبار نفسها للنماذج الثلاثة.
| صيغة النموذج | MAE (kcal) | RMSE (kcal) | الرتبة / الأعمدة |
|---|---|---|---|
| العناصر الغذائية الكبرى | 6.86 | 15.38 | 3 / 3 |
| تفاعلات الفئات | 6.04 | 15.71 | 100 / 100 |
| تفاعلات الكحول والألياف | 4.70 | 13.55 | 126 / 150 |
MAE هو متوسط الخطأ المطلق، وRMSE جذر متوسط مربع الخطأ. كلاهما بكيلو سعر حراري لكل 100 غرام. هذه نتائج مراجعة سبتمبر 2026، وليست نتائج التقديم الأصلي.
رتبة مصفوفة النموذج الأخير 126 من أصل 150 عمودًا، لذلك لا تتحدد المعاملات الفردية بصورة فريدة. قد توجد أغذية متشابهة في التدريب والاختبار، وقد يتحيز اختيار الحالات المكتملة. هذه مقارنة استكشافية داخلية، وليست تحققًا على مجتمع جديد أو أداة تنبؤ سريرية.
اقرأ الكود الذي أنتج النتائج.
يتوفر سكربت المراجعة كاملًا أدناه. يستخدم pandas للتجهيز، والمربعات الصغرى في NumPy للنماذج، وMatplotlib للرسم المبعثر. يبقى الكود بالإنجليزية في النسختين.
افتح سكربت المراجعة كاملًا
"""Reproducible 2026 review of Shamseldeen's 2023 DataCamp nutrition study.

Run: python reviewed_analysis.py --data nutrition.csv --output results
The original study used statsmodels. This companion uses NumPy least squares
to make the specifications and common evaluation sample explicit.
"""
import argparse,json
from pathlib import Path
import numpy as np
import pandas as pd
import matplotlib
matplotlib.use('Agg')
import matplotlib.pyplot as plt

def main():
    parser=argparse.ArgumentParser()
    parser.add_argument('--data',default='nutrition.csv')
    parser.add_argument('--output',default='results')
    args=parser.parse_args()
    out=Path(args.output);out.mkdir(parents=True,exist_ok=True)
    raw=pd.read_csv(args.data)
    names={'Calories':'calories','Protein':'protein','Carbohydrate':'carb','Total fat':'fat','Cholesterol':'cholesterol','Fiber':'fiber','Water':'water','Alcohol':'alcohol','Vitamin C':'vitamin_c'}
    data=raw[['FDC_ID','Item','Category']].copy()
    for src,dst in names.items():
        data[dst]=pd.to_numeric(raw[src].astype('string').str.extract(r'^\s*([-+]?\d+(?:\.\d+)?)',expand=False),errors='coerce')
    # Missing values stay missing; no unverified assumption that missing means zero.
    missing=data[list(names.values())].isna().sum().to_dict()
    sample=data.dropna(subset=['calories','protein','fat','carb','alcohol','fiber']).copy()
    sample=sample.loc[sample.calories>0].reset_index(drop=True)
    # Same rows and deterministic split across all models, stratified by food category.
    rng=np.random.default_rng(42);test_idx=[]
    for _,group in sample.groupby('Category',sort=True):
        ids=group.index.to_numpy();rng.shuffle(ids)
        if len(ids)>=5:test_idx.extend(ids[:max(1,int(len(ids)*.2))])
    test=np.zeros(len(sample),dtype=bool);test[test_idx]=True;train=~test
    categories=pd.get_dummies(sample.Category,dtype=float).to_numpy()
    def matrix(cols,interactions):
        x=sample[cols].to_numpy(dtype=float)
        return np.column_stack([categories]+[categories*x[:,j,None] for j in range(x.shape[1])]) if interactions else x
    specs=[('Macronutrients',['protein','fat','carb'],False),('Category interactions',['protein','fat','carb'],True),('Alcohol and fiber interactions',['protein','fat','carb','alcohol','fiber'],True)]
    metrics=[];y=sample.calories.to_numpy(dtype=float)
    for label,cols,interactions in specs:
        x=matrix(cols,interactions);beta,_,rank,_=np.linalg.lstsq(x[train],y[train],rcond=None)
        pred=x@beta
        err=pred[test]-y[test]
        metrics.append({'model':label,'train_rows':int(train.sum()),'test_rows':int(test.sum()),'parameters':x.shape[1],'rank':int(rank),'test_mae_kcal':float(np.abs(err).mean()),'test_rmse_kcal':float(np.sqrt(np.mean(err**2))),'test_r2':float(1-np.sum(err**2)/np.sum((y[test]-y[test].mean())**2))})
    # Reproduce the saved original baseline using all positive-calorie records.
    baseline=data.loc[data.calories>0].dropna(subset=['protein','fat','carb'])
    coeff=np.linalg.lstsq(baseline[['protein','fat','carb']].to_numpy(dtype=float),baseline.calories.to_numpy(dtype=float),rcond=None)[0]
    correlation=float(data[['water','calories']].corr().iloc[0,1])
    fruits=data[data.Category=='Fruits and Fruit Juices'].dropna(subset=['vitamin_c']).nlargest(5,'vitamin_c')
    result={'reviewDate':'2026-09-23','originalPublicationDate':'2023-12-11','rows':len(raw),'categories':int(raw.Category.nunique()),'completeAllOriginalColumns':int(raw.dropna().shape[0]),'missing':{k:int(v) for k,v in missing.items()},'modelSampleRows':len(sample),'waterCaloriesPearsonR':correlation,'baselineCoefficients':dict(zip(['protein','fat','carb'],map(float,coeff))),'topFruitVitaminC':fruits[['Item','vitamin_c']].to_dict('records'),'models':metrics,'limitations':['A random row split is an internal check, not validation on a new population. Similar products can occur across the split.','Complete-case sampling can be biased; missing alcohol values are common.','Category-interaction models can be rank deficient; least squares provides one minimum-norm solution.','Energy is closely related to nutrient quantities by construction. High R-squared is not clinical evidence.','This descriptive food-composition study cannot infer health outcomes or recommend diets.']}
    (out/'metrics.json').write_text(json.dumps(result,indent=2))
    pd.DataFrame(metrics).to_csv(out/'model_comparison.csv',index=False)
    plt.rcParams.update({'font.family':'DejaVu Sans','axes.spines.top':False,'axes.spines.right':False,'axes.labelcolor':'#10231e','text.color':'#10231e'})
    fig,ax=plt.subplots(figsize=(10,5.8),layout='constrained');fig.patch.set_facecolor('#f6f3eb');ax.set_facecolor('#f6f3eb')
    ax.scatter(data.water,data.calories,s=7,alpha=.18,color='#176b52',edgecolors='none',rasterized=True)
    ax.set(xlabel='Water (g per 100 g food)',ylabel='Energy (kcal per 100 g food)',title='Water content and energy density')
    ax.text(.98,.96,f'7,793 food records · r = {correlation:.2f}',ha='right',va='top',transform=ax.transAxes)
    fig.savefig(out/'water-calories.png',dpi=160);plt.close(fig)
    print(json.dumps(result,indent=2))

if __name__=='__main__':main()
تشغيل التحليل محليًا
انسخ المستودع وشغّل هذه الأوامر من مجلد learning/nutrition. يعيد الأمر الأخير بناء جداول الويب والرسوم الإضافية وصفحتي التحليل الكامل.
python -m pip install -r requirements.txt
python reviewed_analysis.py --data nutrition.csv --output results
python build_web_analysis.pyاقرأ دفتر 2023 المؤرشف.
تظهر أدناه جميع خلايا الأرشيف العام البالغ عددها 99 خلية بلغتها الإنجليزية الأصلية. يحتفظ الأرشيف بالكود التاريخي، مع حذف المخرجات المحفوظة وتعديل عبارة واحدة غير مدعومة عن النتائج الصحية. لم يُعَد تشغيل هذا الدفتر؛ النتائج أعلاه تخص مراجعة 2026 المنفصلة.
تعويض القيم المفقودة بصفر ومقارنات التدريب وشبكات التنبؤ الافتراضية خطوات تعلّم تاريخية. شُرحت المنهجية المُراجعة وحدودها أعلاه.
قراءة جميع الخلايا المؤرشفة الـ99 · بالإنجليزية
Archived 2023 nutrition analysis
Author: Shamseldeen Ismaiil. Original publication: 11 December 2023. Portfolio archive prepared 23 September 2026. Original code is preserved; stored outputs are removed for portability and one unsupported health-outcome statement is replaced by a descriptive limitation. This historical notebook has not been rerun. Known issues include missing-value zero imputation, a mismatch between the described and actual final modeling frame, in-sample model comparison, and extrapolation to impossible nutrient combinations. Read README.md and use reviewed_analysis.py for the reproducible 2026 review.What is good food?
📖 Background
You and your friend have gotten into a debate about nutrition. Your friend follows a high-protein diet and does not eat any carbohydrates (no grains, no fruits). You claim that a balanced diet should contain all nutrients but should be low in calories. Both of you quickly realize that most of what you know about nutrition comes from mainstream and social media. Being the data scientist that you are, you offer to look at the data yourself to answer a few key questions.💾 The data
You source nutrition data from USDA's FoodData Central website. This data contains the calorie content of 7,793 common foods, as well as their nutritional composition. Each row represents one food item, and nutritional values are based on a 100g serving. Here is a description of the columns: - FDC_ID: A unique identifier for each food item in the database. - Item: The name or description of the food product. - Category: The category or classification of the food item, such as "Baked Products" or "Vegetables and Vegetable Products". - Calories: The energy content of the food, presented in kilocalories (kcal). - Protein: The protein content of the food, measured in grams. - Carbohydrate: The carbohydrate content of the food, measured in grams. - Total fat: The total fat content of the food, measured in grams. - Cholesterol: The cholesterol content of the food, measured in milligrams. - Fiber: The dietary fiber content of the food, measured in grams. - Water: The water content of the food, measured in grams. - Alcohol: The alcohol content of the food (if any), measured in grams. - Vitamin C: The Vitamin C content of the food, measured in milligrams.Cell 04 / 99 · code
import pandas as pd
df_food = pd.read_csv('nutrition.csv')
summary:
Create a report that covers the following: 1. fruit has the highest vitamin C and some other sources of vitamin C. 2. the relationship between the calories and water content 3. possible drawbacks of a zero-carb diet drawbacks of a very high-protein diet. 4. fit a linear model to find that kcal in protein, carbohydrates and fat. 5. Alcohol as a source of calories.Cell 07 / 99 · code
df_food.info()Cell 09 / 99 · code
df_food_Nna = df_food.dropna()
df_food_Nna.info()
Cell 11 / 99 · code
import numpy as np
df_food[['Vitamin C','Cholesterol']] = df_food[['Vitamin C','Cholesterol']].fillna('0.0 mg')
df_food[['Fiber','Alcohol']]= df_food[['Fiber','Alcohol']].fillna('0.0 g')
Cell 13 / 99 · code
def DataframeAddCol(df, dic):
    """
    Function to convert string columns with 'mg, g, kca, ...' to float and add new columns to the dataframe.
    df: DataFrame, dic: dictionary of column names and measurements like mg, g, ...
    """
    for i, x in dic.items():
        new_col_name = i + "_" + x
        df[new_col_name] = pd.to_numeric(df[i].str.split(x).str[0], errors='coerce')
    return df
Cell 15 / 99 · code
dictcol = {"Calories":"kcal",
          "Protein":"g",
          "Carbohydrate":"g",
          "Total fat":"g",
          "Cholesterol":"mg",
          "Fiber":"g",
          "Water":"g",
          "Alcohol":"g",
          "Vitamin C":"mg"}
DataframeAddCol(df_food,dictcol)
Cell 17 / 99 · code
print(df_food.info())Cell 19 / 99 · code
df_food_No = df_food[['FDC_ID','Item','Category','Calories_kcal',
              'Protein_g',
              'Carbohydrate_g',
              'Total fat_g',
              'Cholesterol_mg',
              'Fiber_g',
              'Water_g',
              'Alcohol_g',
              'Vitamin C_mg']]


df_food_No.info()
Cell 21 / 99 · code
highCfood = df_food_No[df_food['Vitamin C_mg'] == df_food['Vitamin C_mg'].max()]
Cell 22 / 99 · code
highCfoodCell 24 / 99 · code
df_foodFruit = df_food[df_food['Category'].isin(['Fruits and Fruit Juices'])]
df_foodFruit_HvitC = df_foodFruit[df_foodFruit['Vitamin C_mg'] == df_foodFruit['Vitamin C_mg'].max()]
itemFruitHC = list(df_foodFruit_HvitC['Item'])
ConcVitC = df_foodFruit_HvitC['Vitamin C_mg']

print(f"Now,the fruit has the heighest vitamin C content,This fruit is named '{itemFruitHC[0].split(',')[0]}' and it has a concentration of vitamin C equal {int(ConcVitC)} mg.")
Cell 25 / 99 · code
import seaborn as sns
import matplotlib.pyplot as plt
df_food_No['Vitamin_C_mg'] = df_food_No['Vitamin C_mg']
ConcVitC = float(ConcVitC)

df_food_No['point_type'] = ['Highest vitC Fruit "Acerola"' if VitC == ConcVitC else 'Others' for VitC in df_food_No.Vitamin_C_mg]
sns.scatterplot(x = 'Vitamin_C_mg',
                y = 'Water_g',
                hue = 'point_type',
                data = df_food_No)
plt.show()
Cell 27 / 99 · code
def highconc(column1,colNam='Vitamin C_mg',df0=df_food):
    """
    column1 is category of item
    column2 is numeric to take max
    take the max vitamin c in each item in column
    return all dataframe columns
    but only unique item of selected column
    """
    listcolumn1 = list(column1.unique())
    df = pd.DataFrame()
    for i in listcolumn1:
        df1 = df0[column1.isin([i])]

        df2 = df1[df1[colNam] == df1[colNam].max()]
        df = pd.concat([df2, df], ignore_index=True)

    return df
Cell 28 / 99 · code
dfhighC = highconc(df_food_No['Category'],df0=df_food_No)
Cell 29 / 99 · code
dfhighC.drop(index=18,axis=0,inplace=True)
Cell 31 / 99 · code
dfhighC[['Item','Category','Vitamin_C_mg']].sort_values('Vitamin_C_mg', ascending=False)
Cell 32 / 99 · code
df_foodVeg = df_food[df_food['Category'].isin(['Vegetables and Vegetable Products'])]Cell 33 / 99 · code
Top10Fruit = df_foodFruit.sort_values('Vitamin C_mg', ascending= False).head(10)
Top10Veg = df_foodVeg.sort_values('Vitamin C_mg', ascending= False).head(10)
Top10dfFood = df_food.sort_values('Vitamin C_mg', ascending=False).head(10)

Alternative10 = dfhighC.sort_values('Vitamin C_mg',ascending=False).head(10)
Cell 35 / 99 · code
Alternative10[['Item','Category','Vitamin C_mg']].reset_index(drop=True)Cell 37 / 99 · code
Top10dfFood[['Item','Vitamin C_mg']].reset_index(drop=True)Cell 39 / 99 · code
Top10Veg[['Item','Vitamin C_mg']].reset_index(drop=True)Cell 41 / 99 · code
Top10Fruit[['Item','Vitamin C_mg']].reset_index(drop=True)Cell 43 / 99 · code
sns.regplot(y='Calories_kcal',
            x='Water_g',
            data=df_food,
            ci=None)

plt.show()What are the possible drawbacks of a zero-carb diet?
Cell 45 / 99 · code
ZeroCarb = df_food_No[df_food_No['Carbohydrate_g' ]== 0.0]
ZeroCarb.info()
Cell 46 / 99 · code
ZeroCarb[['Calories_kcal','Total fat_g', 'Cholesterol_mg']].mean()Cell 47 / 99 · code
df_food_No[['Calories_kcal','Total fat_g', 'Cholesterol_mg']].mean()What could be the drawbacks of a very high-protein diet?
Cell 49 / 99 · code
Top_500_high_protein = df_food_No.sort_values('Protein_g',ascending=False).head(500)
Top_500_high_protein.sort_values('Cholesterol_mg',ascending=False)
Cell 50 / 99 · code
Top_500_high_protein[['Calories_kcal','Total fat_g', 'Cholesterol_mg']].mean()Descriptive cholesterol comparison
These selected food groups have different cholesterol levels in this dataset. This comparison cannot establish disease risk or clinical diet effects.According to the Cleveland Clinic website, a gram of fat has around 9 kilocalories, and a gram of protein and a gram of carbohydrate contain 4 kilocalories each. Fit a linear model to test whether these estimates agree with the data.
Cell 53 / 99 · code
NoZeroCal = df_food_No[df_food_No['Calories_kcal'] != 0.0]
NoZeroCal['Fat_g'] = NoZeroCal['Total fat_g']
Cell 54 / 99 · code
NoZeroCal.info()Cell 56 / 99 · code
from statsmodels.formula.api import ols
# Fit the model
mdl_calories_vs_P_F_C = ols('Calories_kcal ~ Protein_g + Fat_g + Carbohydrate_g + 0', data=NoZeroCal).fit()

# Create the explanatory data
explanatory_dataPFC = pd.DataFrame({'Protein_g': [1, 0, 0,0,10,5.88,200],
                                   'Fat_g': [0, 1, 0,0,20,13.24,100],
                                   'Carbohydrate_g': [0, 0, 1,0,15,41.18,100]})
# Predict 'Calories_kcal'
prediction_data = explanatory_dataPFC.assign(Calories_kcal=mdl_calories_vs_P_F_C.predict(explanatory_dataPFC))

# Calculate MSE and RSE
mse = mdl_calories_vs_P_F_C.mse_resid
rse = np.sqrt(mse)
Cell 57 / 99 · code
df_food_No.iloc[0][3:7]Cell 58 / 99 · code
print(mdl_calories_vs_P_F_C.params)Cell 59 / 99 · code
explanatory_dataPFCCell 60 / 99 · code
print(mdl_calories_vs_P_F_C.rsquared)
print(mdl_calories_vs_P_F_C.rsquared_adj)Analyze the errors of your linear model to see what could be the hidden sources of calories in food.
Cell 62 / 99 · code
print('MSE :', mse)
print('RSE :', rse)
Cell 63 / 99 · code
prediction_dataCell 64 / 99 · code
plt.figure()
sns.regplot(y='Calories_kcal',
            x='Protein_g',
            data=NoZeroCal,
            ci=None,
            scatter_kws={'alpha': 0.5},
            color=sns.color_palette("deep")[0],
            label='Protein')
sns.regplot(y='Calories_kcal',
            x='Fat_g',
            data=NoZeroCal,
            ci=None,
            scatter_kws={'alpha': 0.5},
            color=sns.color_palette("deep")[1],
            label='Fat')
sns.regplot(y='Calories_kcal',
            x='Carbohydrate_g',
            data=NoZeroCal,
            ci=None,
            scatter_kws={'alpha': 0.5},
            color=sns.color_palette("deep")[2],
            label='Carbohydrate')

plt.xlabel('Grams')
plt.ylabel('Calories (kcal)')
plt.legend()
plt.show()
Cell 65 / 99 · code
NoZeroCalCell 66 / 99 · code
from statsmodels.formula.api import ols
# Fit the model
mdl_calories_vs_P_F_C_cat = ols('Calories_kcal ~ Protein_g + Fat_g + Carbohydrate_g + Category + Category : Protein_g + Category:Fat_g + Category : Carbohydrate_g + 0', data=NoZeroCal).fit()
Cell 67 / 99 · code
from itertools import product Cell 68 / 99 · code
catList = list(NoZeroCal['Category'].unique())
proteinList = np.arange(0,50,10)
fatList = np.arange(0,50,10)
carbohydrateList = np.arange(0,50,10)
Cell 69 / 99 · code
p = product(catList, proteinList, fatList, carbohydrateList)Cell 70 / 99 · code
explanatoryDataPFCcat = pd.DataFrame(p,
    columns=["Category",
"Protein_g",
"Fat_g",
"Carbohydrate_g"])
Cell 71 / 99 · code
explanatoryDataPFCcatCell 72 / 99 · code
mse1 = mdl_calories_vs_P_F_C_cat.mse_resid
rse1 = np.sqrt(mse1)
print(mdl_calories_vs_P_F_C_cat.rsquared_adj)
print(mdl_calories_vs_P_F_C_cat.rsquared)
print("MSE:",mse1)
print("RSE:",rse1)
Cell 73 / 99 · code
predictionData = explanatoryDataPFCcat.assign(
    Calories_kcal = mdl_calories_vs_P_F_C_cat.predict(explanatoryDataPFCcat)
)
Cell 74 / 99 · code
predictionDataCell 75 / 99 · code
predp = predictionData[predictionData['Protein_g'] == 10]
predf = predictionData[predictionData['Fat_g'] == 10]
predcarb = predictionData[predictionData['Carbohydrate_g'] == 10]
Cell 76 / 99 · code
predpZeroF = predp[predp['Fat_g'] == 0]
predfZeroP = predf[predf['Protein_g'] == 0]
predcarbZeroP = predcarb[predcarb['Protein_g'] == 0]
Cell 77 / 99 · code
predpZeroFZeroCarb = predpZeroF[predpZeroF['Carbohydrate_g'] == 0]
predfZeroPZeroCarb = predfZeroP[predfZeroP['Carbohydrate_g'] == 0]
predcarbZeroPZeroF = predcarbZeroP[predcarbZeroP['Fat_g'] == 0]
Cell 78 / 99 · code
print("Calories mean in 10 gm protein:",predpZeroFZeroCarb["Calories_kcal"].mean())
print("Calories mean in 10 gm Fat:",predfZeroPZeroCarb["Calories_kcal"].mean())
print("Calories mean in 10 gm carbohydrates :",predcarbZeroPZeroF["Calories_kcal"].mean())the last model is better that the first and it doesn't work with very small amount of fat , carbohydrates and proteins. we find that 1gm of fat equal 9 kcal and 1 gm of protein and carbohydrate equal 4 kcal.
for example as first row of dataframe NoZeroCal we predict the calories of first row as 300
we find around 7 calories as a difference
to see what could be the hidden sources of calories in food
fit model to discover the hidden sources of calories
may be from fiber or alcohol. so we use df_food_Nna to drop any missing data. So we fit another model to predict if alcohol and fiber produce calories.
Cell 84 / 99 · code
df_food_Nna_no = DataframeAddCol(df_food_Nna,dictcol)Cell 85 / 99 · code
NoZeroCalNna = df_food_Nna_no[df_food_Nna_no['Calories_kcal'] != 0.0]Cell 86 / 99 · code
NoZeroCalNna.info()Cell 87 / 99 · code
mdl_calories_vs_All = ols('Calories_kcal ~ Protein_g + Fat_g + Carbohydrate_g + Alcohol_g + Fiber_g + Category + Category : Protein_g + Category:Fat_g + Category : Carbohydrate_g + Category : Alcohol_g + Category : Fiber_g + 0', data=NoZeroCal).fit()Cell 88 / 99 · code
CatList = list(NoZeroCalNna['Category'].unique())
AlcList = np.arange(0,50,10)
FibList = np.arange(0,50,10)
proteinList = np.arange(0,50,10)
fatList = np.arange(0,50,10)
carbohydrateList = np.arange(0,50,10)
Cell 89 / 99 · code
p1 = product(CatList, AlcList, FibList, proteinList, fatList, carbohydrateList )Cell 90 / 99 · code
explanatoryDataAll = pd.DataFrame(p1,
    columns=["Category",
"Alcohol_g",
"Fiber_g",
            "Protein_g",
            "Fat_g",
            "Carbohydrate_g"])
Cell 91 / 99 · code
mse2 = mdl_calories_vs_All.mse_resid
rse2 = np.sqrt(mse2)
print(mdl_calories_vs_All.rsquared_adj)
print(mdl_calories_vs_All.rsquared)
print("MSE:",mse2)
print("RSE:",rse2)
Cell 92 / 99 · code
predictionDataAll = explanatoryDataAll.assign(
    Calories_kcal = mdl_calories_vs_All.predict(explanatoryDataAll)
)
Cell 93 / 99 · code
predictionDataAllCell 94 / 99 · code
def dfonecolvalue(df, col1, val1, val2,li):
    """
    make one column with val1 and selected column of df in li list set their values to val2.
    df: dataframe of choice.
    col1: column that you want to set to the selected value.
    val1: value you want to select from col1.
    val2: value you want to select from all columns of the dataframe.
    li list of columns that set values to val2


    Returns a new dataframe named as df + col1 + val1.
    """
    new_df = df.copy()  # Create a copy of the original dataframe
    new_df = new_df[new_df[col1]==val1]
    for i in li:
        new_df = new_df[new_df[i]==val2]

    return new_df
Cell 95 / 99 · code
listAlc = ["Fiber_g","Protein_g","Fat_g","Carbohydrate_g"]
listFiber = ["Alcohol_g","Protein_g","Fat_g","Carbohydrate_g"]


df_10_Alc_predict = dfonecolvalue(predictionDataAll,"Alcohol_g",10,0,listAlc)
df_10_Fib_predict = dfonecolvalue(predictionDataAll,"Fiber_g",10,0,listFiber)
Cell 96 / 99 · code
df_10_Alc_predict["Calories_kcal"].mean()Cell 97 / 99 · code
df_10_Fib_predict["Calories_kcal"].mean()last we see that alcohol can give us around 7 kcal, this is hidden source of calories.
please, leave comment to help me to improve my skills
thanks 🙏 🌹❤️
النشر الأصلي: 11 ديسمبر 2023. البيانات: مسابقة DataCamp بعنوان «What Foods Are the Most Nutritious?» والمعدّلة من USDA FoodData Central. كانت مسابقة تعلّم دون تحكيم. USDA FoodData Central ↗