Open to Junior Data Engineer & Data Analyst roles

I find where pharmacy
chains lose money.

A pharmacist with 11+ years in Saudi retail pharmacy. I build the data pipelines and dashboards that turn sales, stock and staff records into one clear answer: where the money goes, and what to do next.

11+
Years in pharmacy retail
60M rows
From raw files to dashboard on Microsoft Fabric
2 projects
Published, documented, on GitHub

Problems I solved.
Proof you can open.

Each project in three lines: the problem, what I built, and the result. Details and code are one click away.

Flagship · CompletedMicrosoft Fabric · PySpark · SQL · Power BI

Why a growing pharmacy chain loses money

Problem: a 1,000-branch chain sold more every year and still lost money. What I did: built the full data platform, from raw files to a 6-page report. Result: 2.6% of products cause 99.8% of the loss below cost.

  • 60 million rows moved and reconciled with zero difference
  • 314 products bought at about 10x their price, with the supplier discount needed for each
  • 7 fraud signals tested honestly before blaming anyone

Independent portfolio project · Synthetic data · No employer or patient data
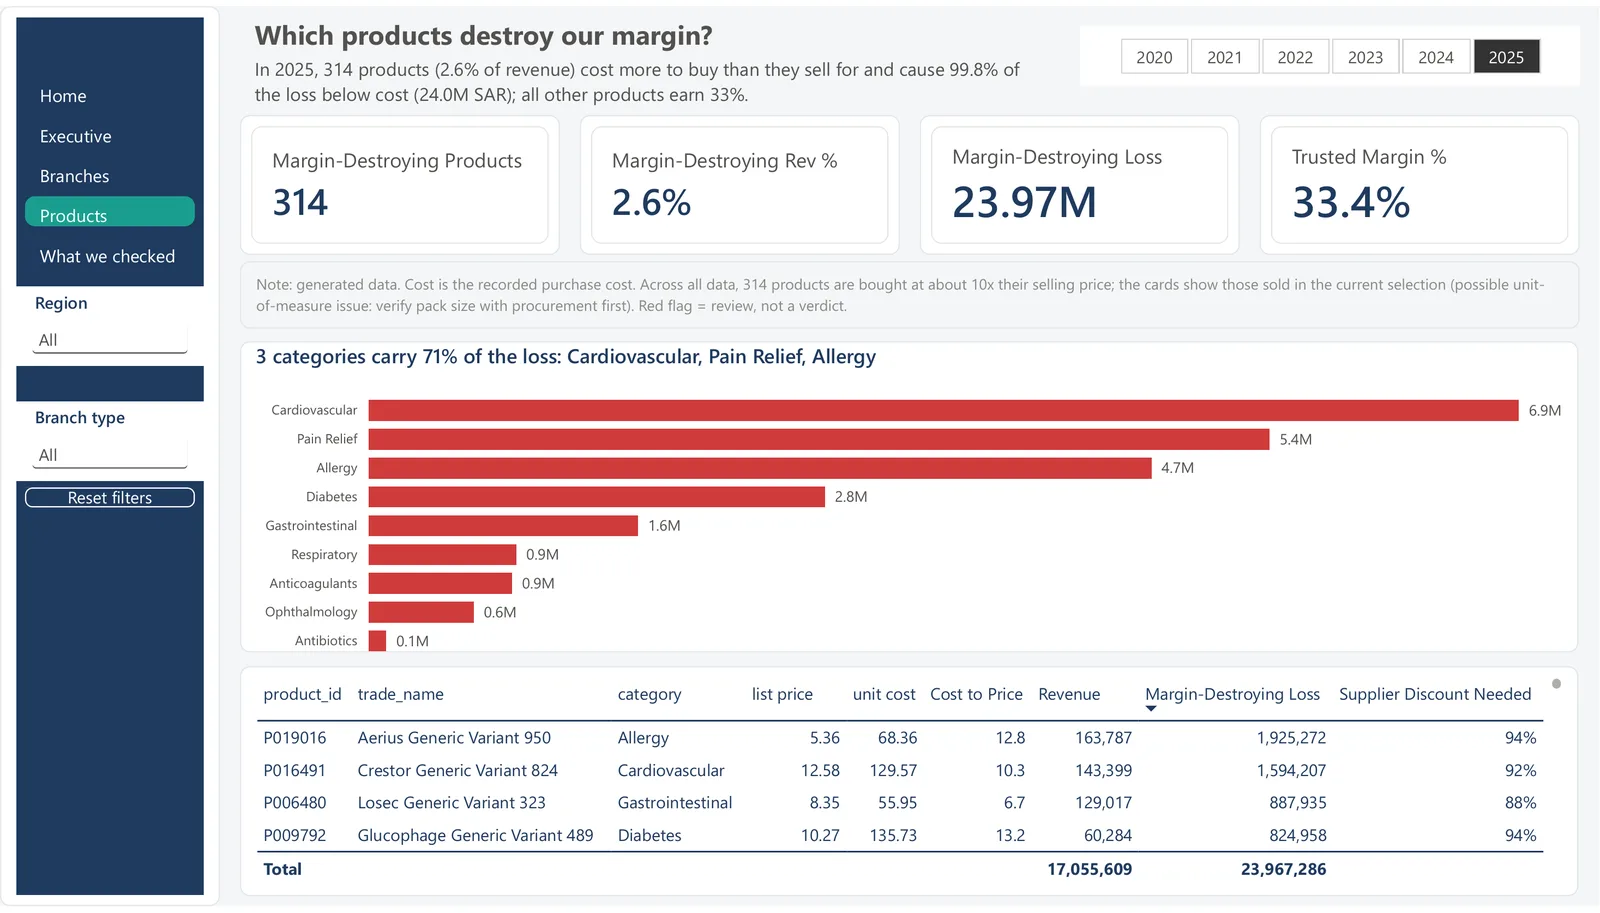
Products page: 314 products cause 23.97 million SAR loss in 2025See where the money goes →
Live reportPower BI · Power Query · DAX

Why a drug distributor missed its target

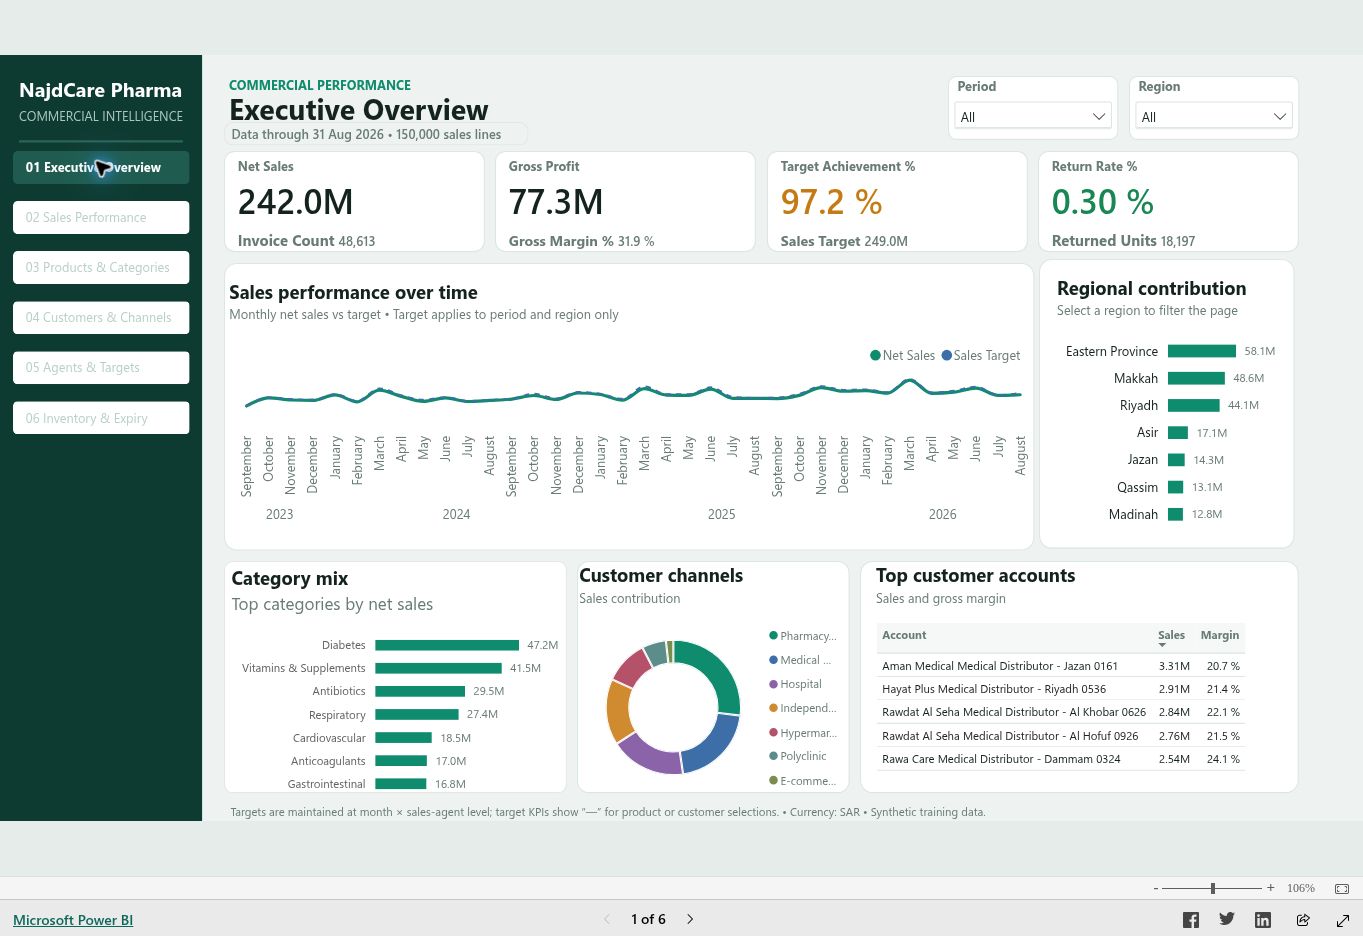
Problem: a Saudi drug distributor reached 97.2% of target, SAR 7.0M short. What I did: a 6-page Power BI report on sales, targets, discounts and stock. Result: the sales team was not the cause; discounts (2x the gap) and stock in the wrong place were.

  • 68 of 72 agents within 5% of target: a shared cause, not weak people
  • SAR 14.1M in discounts against a SAR 7.0M gap
  • 27 stockouts while SAR 825K of stock was near expiry

Independent portfolio project · Synthetic training data · No employer or patient data

Published Power BI Executive Overview dashboardExplore the interactive report →

Earlier work and next project

An illustrative arrangement of acerola and guava
Acerola & guava · editorial illustration
Published learning studyPython · pandas · Regression

Vitamin C & Calorie Modeling

Which fruit has the most vitamin C? Explore 7,793 foods across 25 categories through data cleaning, nutrient comparisons, visualization and calorie modeling.

Original DataCamp publication: December 2023. Includes a reproducible review with model assumptions and evaluation limits.

Read the full analysis and code →
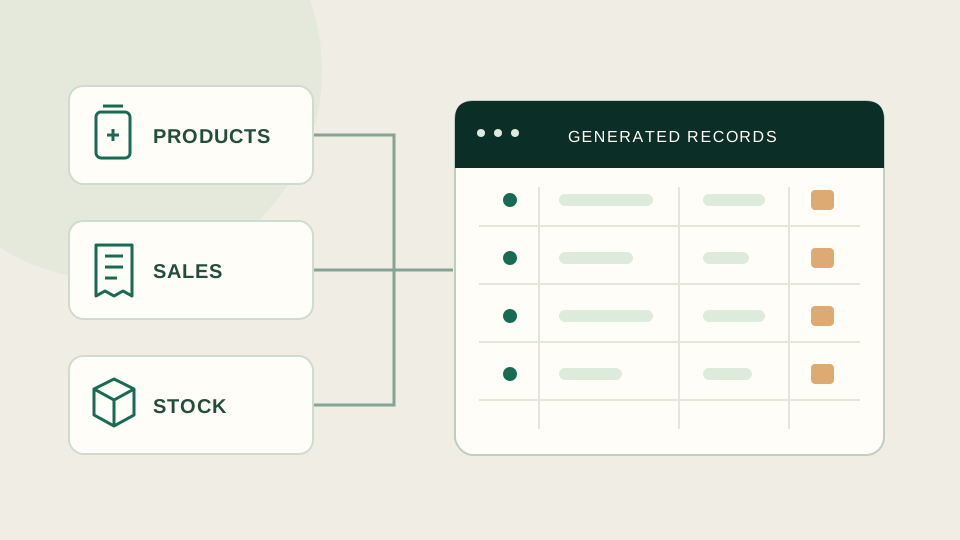
Conceptual diagram of pharmacy sources feeding generated records
Products, sales & stock · synthetic data
Supporting · In progress SQL · Python

Synthetic Pharmacy Data Platform

Building realistic source data for a large pharmacy chain to feed and test the enterprise data warehouse across operational domains.

View development work ↗
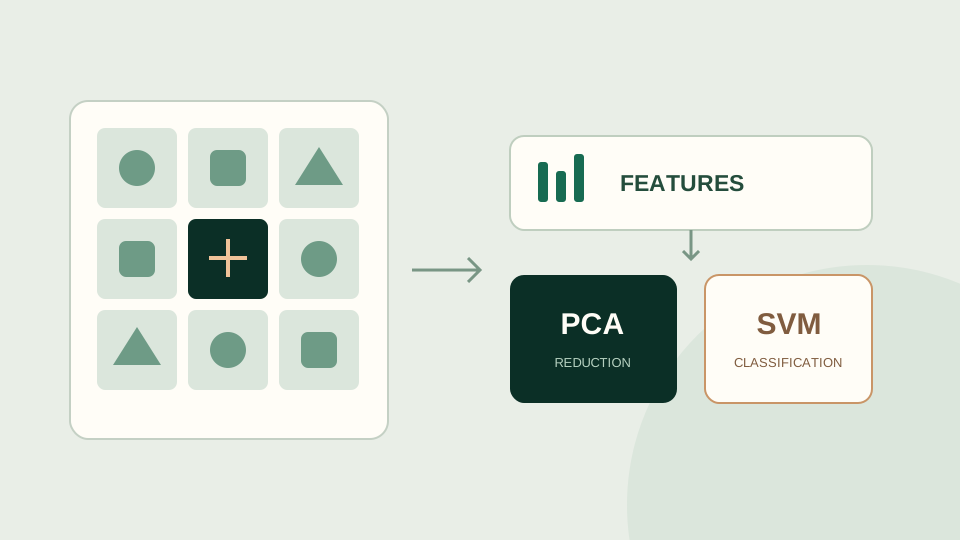
Conceptual illustration of image features, PCA and SVM; not model results
Image features · PCA · SVM
Exploratory study Python · ML

Histopathology Image Exploration

An early machine-learning notebook exploring image features, PCA and SVM classification using the UBC Ovarian Cancer dataset.

A pharmacist who speaks data.

I have worked at Aldawaa Pharmacies since 2015 across customer service, sales, insurance workflows and branch operations. That experience gives me practical context for the numbers behind retail and healthcare decisions.

I now build the data side of that work: pipelines that move and check millions of records, warehouses that keep one version of the truth, and reports that answer a manager’s question in one sentence. My projects use synthetic or public data, and every number is reconciled.

01

Data Engineering

Microsoft Fabric, PySpark, Delta Lake, T-SQL stored procedures, Medallion architecture, star schemas, reconciliation and Git.

02

Business Intelligence

Power BI (Direct Lake, DAX, TMDL), dashboard design that answers one question per page, Tableau and data storytelling.

03

Python & Analysis

Pandas, NumPy, data cleaning, exploratory analysis, visualization and analytical automation.

04

Business & Domain

Retail analytics, pharmacy operations, insurance workflows, sales, customer service and inventory KPIs.

Microsoft Fabric PySpark SQL Server Python Power BI Tableau Excel Git GitHub
2015 — Present

Aldawaa Pharmacies

Pharmacist · Retail Pharmacy Operations

  • 11+ years across pharmacy operations, customer care, sales and insurance processes.
  • Five years in a major branch, four as pharmacist-in-charge of a two-person team: built relationships with nearby hospitals; insurance sales grew about 3x and branch sales about 75%.
  • About 9 years as pharmacist-in-charge across three branches, leading the branch team and fellow pharmacists by example.
  • Current branch: raised daily sales about 13% for three months by fixing stock-outs and merchandising, and co-led a full branch relocation (about 5,000 items counted in 5 days, reconciled with pivot tables).
  • Used sales data analysis to guide branch actions, contributing to a 10% increase in daily sales.
Education Alexandria University

Bachelor of Pharmaceutical Sciences · 2013

74 completed DataCamp courses and 7 tracks in Python, SQL and statistics. See credentials and practice projects ↗

Available for the next challenge

Let’s find where your data hides the money.

Open to Junior Data Engineer, Data Analyst and BI roles, in healthcare, retail and beyond.